
The JDK Flight Recorder (JFR) is an invaluable tool for gaining deep insights into the performance characteristics of Java applications. Open-sourced in JDK 11, JFR provides a low-overhead framework for collecting events from Java applications, the JVM and the operating system.
In this blog post we’re going to explore how custom, application-specific JFR events can be used to monitor a REST API, allowing to track request counts, identify long-running requests and more. We’ll also discuss how the JFR Event Streaming API new in Java 14 can be used to export live events, making them available for monitoring and alerting via tools such as Prometheus and Grafana.
JFR and its companion tool JDK Mission Control (JMC) for analyzing JFR recordings have come a long way; originally developed at BEA and part of the JRockit VM, they were later on commercial features of the Oracle JDK. As of Java 11, JFR got open-sourced and is part of OpenJDK distributions. JMC is also open-source, but it’s an independent tool under the OpenJDK umbrella, which must be downloaded separately.
Using the combination of JFR and JMC, you can get all kinds of information about your Java application, such as events on garbage collection, compilation, classloading, memory allocation, file and socket IO, method profiling data, and much more. To learn more about Flight Recorder and Mission Control in general, have a look at the Code One 2019 presentation Introduction to JDK Mission Control & JDK Flight Recorder by Marcus Hirt and Klara Ward. You can find some more links to related useful resources towards the end of this post.
Custom Flight Recorder Events
One thing that’s really great about JFR and JMC is that you’re not limited to the events and data baked into the JVM and platform libraries: JFR also provides an API for implementing custom events. That way you can use the low-overhead event recording infrastructure (its goal is to add at most 1% performance overhead) for your own event types. This allows you to record and analyze higher-level events, using the language of your application-specific domain.
Taking my day job project Debezium as an example (an open-source platform for change data capture for a variety of databases), we could for instance produce events such as "Snapshot started", "Snapshotting of table 'Customers' completed", "Captured change event for transaction log offset 123" etc. Users could send us recordings with these events and we could dive into them, in order to identify bugs or performance issues.
In the following let’s consider a less complex and hence better approachable example, though. We’ll implement an event for measuring the duration of REST API calls. The Todo service from my recent blog post on Quarkus Qute will serve as our guinea pig. It is based on the Quarkus stack and provides a simple REST API based on JAX-RS. As always, you can find the complete source code for this blog post on GitHub.
Event types are implemented by extending the jdk.jfr.Event class;
It already provides us with some common attributes such as a timestamp and a duration.
In sub-classes you can add application-specific payload attributes,
as well as some metadata such as a name and category which will be used for organizing and displaying events when looking at them in JMC.
Which attributes to add depends on your specific requirements; you should aim for the right balance between capturing all the relevant information that will be useful for analysis purposes later on, while not going overboard and adding too much, as that could cause record files to become too large, in particular for events that are emitted with a high frequency. Also retrieval of the attributes should be an efficient operation, so to avoid any unneccessary overhead.
Here’s a basic event class for monitoring our REST API calls:
 1
 2
 3
 4
 5
 6
 7
 8
 9
10
11
12
13
14
15
16
17
18
19
20
21
22
23
24
25
26
27
28
29
30
31
32
33
34
35
36
37
38
39
40
@Name(JaxRsInvocationEvent.NAME) (1)
@Label("JAX-RS Invocation")
@Category("JAX-RS")
@Description("Invocation of a JAX-RS resource method")
@StackTrace(false) (2)
public class JaxRsInvocationEvent extends Event {

  static final String NAME = "dev.morling.jfr.JaxRsInvocation";

  @Label("Resource Method") (3)
  public String method;

  @Label("Media Type")
  public String mediaType;

  @Label("Java Method")
  public String javaMethod;

  @Label("Path")
  public String path;

  @Label("Query Parameters")
  public String queryParameters;

  @Label("Headers")
  public String headers;

  @Label("Length")
  @DataAmount (4)
  public int length;

  @Label("Response Headers")
  public String responseHeaders;

  @Label("Response Length")
  public int responseLength;

  @Label("Response Status")
  public int status;
}
| 1 | The @Name, @Category, @Description and @Label annotations define some meta-data, e.g. used for controlling the appearance of these events in the JMC UI |
| 2 | JAX-RS invocation events shouldn’t contain a stacktrace by default, as that’d only increase the size of Flight Recordings without adding much value |
| 3 | One payload attribute is defined for each relevant property such as HTTP method, media type, the invoked path etc. |
| 4 | @DataAmount tags this attribute as a data amount (by default in bytes) and will be displayed accordingly in JMC; there are many other similar annotations in the jdk.jfr package, such as @MemoryAddress, @Timestamp and more |
Having defined the event class itself, we must find a way for emitting event instances at the right point in time. In the simplest case, e.g. suitable for events related to your application logic, this might happen right in the application code itself. For more "technical" events it’s a good idea though to keep the creation of Flight Recorder events separate from your business logic, e.g. by using mechanisms such as servlet filters, interceptors and similar, which allow to inject cross-cutting logic into the call flow of your application.
You also might employ byte code instrumentation at build or runtime for this purpose.
The JMC Agent project aims at providing a configurable Java agent that allows to dynamically inject code for emitting JFR events into running programs.
Via the EventFactory class, the JFR API also provides a way for defining event types dynamically,
should their payload attributes only be known at runtime.
For monitoring a JAX-RS based REST API,
the ContainerRequestFilter and ContainerResponseFilter contracts come in handy,
as they allow to hook into the request handling logic before and after a REST request gets processed:
 1
 2
 3
 4
 5
 6
 7
 8
 9
10
11
12
13
14
15
16
17
18
19
20
21
22
23
24
25
26
27
28
29
30
31
32
33
34
35
36
37
38
39
40
41
42
43
44
45
46
47
48
49
50
51
52
53
54
55
@Provider (1)
public class FlightRecorderFilter implements ContainerRequestFilter,
    ContainerResponseFilter {

  @Override (2)
  public void filter(ContainerRequestContext requestContext)
      throws IOException {

    JaxRsInvocationEvent event = new JaxRsInvocationEvent();

    if (!event.isEnabled()) { (3)
      return;
    }

    event.begin(); (4)

    requestContext.setProperty(JaxRsInvocationEvent.NAME, event); (5)
  }

  @Override (6)
  public void filter(ContainerRequestContext requestContext,
      ContainerResponseContext responseContext) throws IOException {
    JaxRsInvocationEvent event = (JaxRsInvocationEvent) requestContext
        .getProperty(JaxRsInvocationEvent.NAME);

    if (event == null || !event.isEnabled()) {
      return;
    }

    event.end(); (7)
    event.path = String.valueOf(requestContext.getUriInfo().getPath());

    if (event.shouldCommit()) { (8)
      event.method = requestContext.getMethod();
      event.mediaType = String.valueOf(requestContext.getMediaType());
      event.length = requestContext.getLength();
      event.queryParameters = requestContext.getUriInfo()
          .getQueryParameters().toString();
      event.headers = requestContext.getHeaders().toString();
      event.javaMethod = getJavaMethod(requestContext);
      event.responseLength = responseContext.getLength();
      event.responseHeaders = responseContext.getHeaders().toString();
      event.status = responseContext.getStatus();

      event.commit(); (9)
    }
  }

  private String getJavaMethod(ContainerRequestContext requestContext) {
    String propName = "org.jboss.resteasy.core.ResourceMethodInvoker";
    ResourceMethodInvoker invoker =
        (ResourceMethodInvoker)requestContext.getProperty(propName);
    return invoker.getMethod().toString();
  }
}
| 1 | Allows the filter to be picked up automatically by the JAX-RS implementation |
| 2 | Will be invoked before the request is processed |
| 3 | Nothing to do if the event type is not enabled for recordings currently |
| 4 | Begin the timing of the event |
| 5 | Store the event in the request context, so it can be obtained again later on |
| 6 | Will be invoked after the request has been processed |
| 7 | End the timing of the event |
| 8 | The event should be committed if it is enabled and its duration is within the threshold configured for it; in that case, populate all the payload attributes of the event based on the values from the request and response contexts |
| 9 | Commit the event with Flight Recorder |
With that, our event class is pretty much ready to be used. There’s only one more thing to do, and that is registering the new type with the Flight Recorder system. A Quarkus application start-up lifecycle method comes in handy for that:
1
2
3
4
5
6
7
@ApplicationScoped
public class Metrics {

  public void registerEvent(@Observes StartupEvent se) {
    FlightRecorder.register(JaxRsInvocationEvent.class);
  }
}
Note this step isn’t strictly needed, the event type can also be used without explicit registration. But doing so will later on allow to apply specific settings for the event in Mission Control (see below), also if no event of this type has been emitted yet.
Creating JFR Recordings
Now let’s capture some JAX-RS API events using Flight Recorder and inspect them in Mission Control.
To do so, make sure to have Mission Control installed. Just as with OpenJDK, there are different builds for Mission Control to choose from. If you’re in the Fedora/RHEL universe, there’s a repository package which you can install, e.g. like this for the Fedora JMC package:
1
sudo dnf module install jmc:7/default
Alternatively, you can download builds for different platforms from Oracle; some more info about these builds can be found in this blog post by Marcus Hirt. There’s also the Liberica Mission Control build by BellSoft and Zulu Mission Control by Azul. The AdoptOpenJDK provides snapshot builds of JMC 8 as well as an Eclipse update site for installing JMC into an existing Eclipse instance.
If you’d like to follow along and run these steps yourself, check out the source code from GitHub and then perform the following commands:
1
2
cd example-service && mvn clean package && cd ..
docker-compose up --build
This builds the project using Maven and spins up the following services using Docker Compose:
-
example-service: The Todo example application
-
todo-db: The Postgres database used by the Todo service
-
prometheus and grafana: For monitoring live events later on
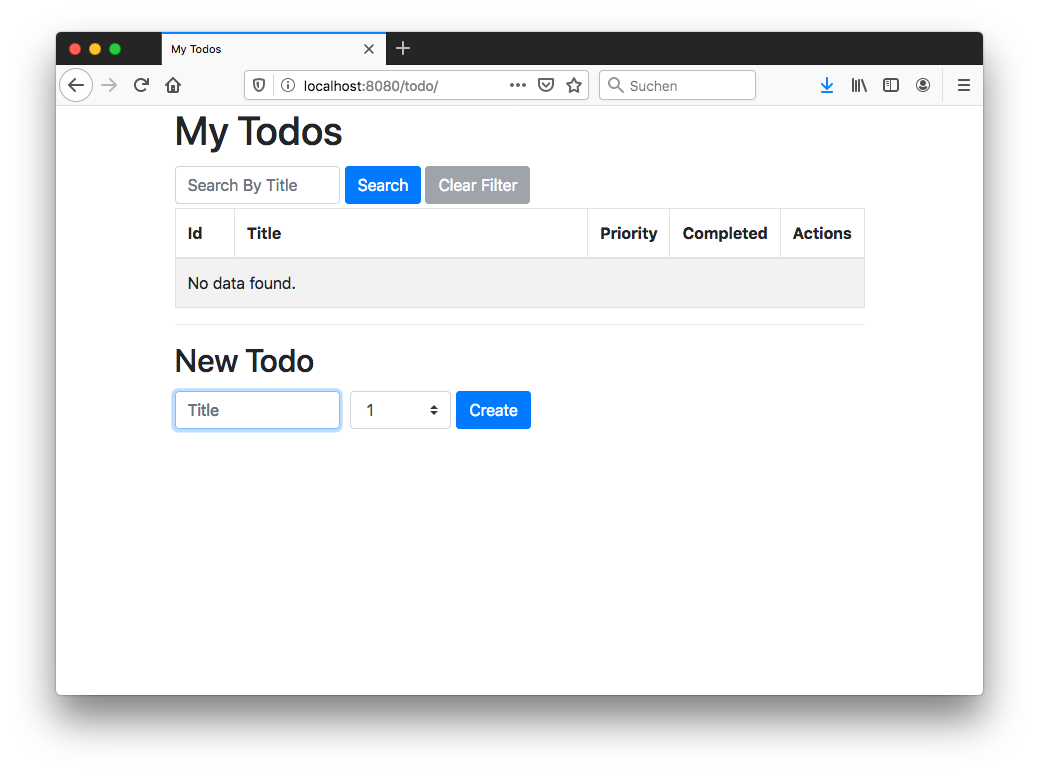
Then go to http://localhost:8080/todo, where you should see the Todo web application:
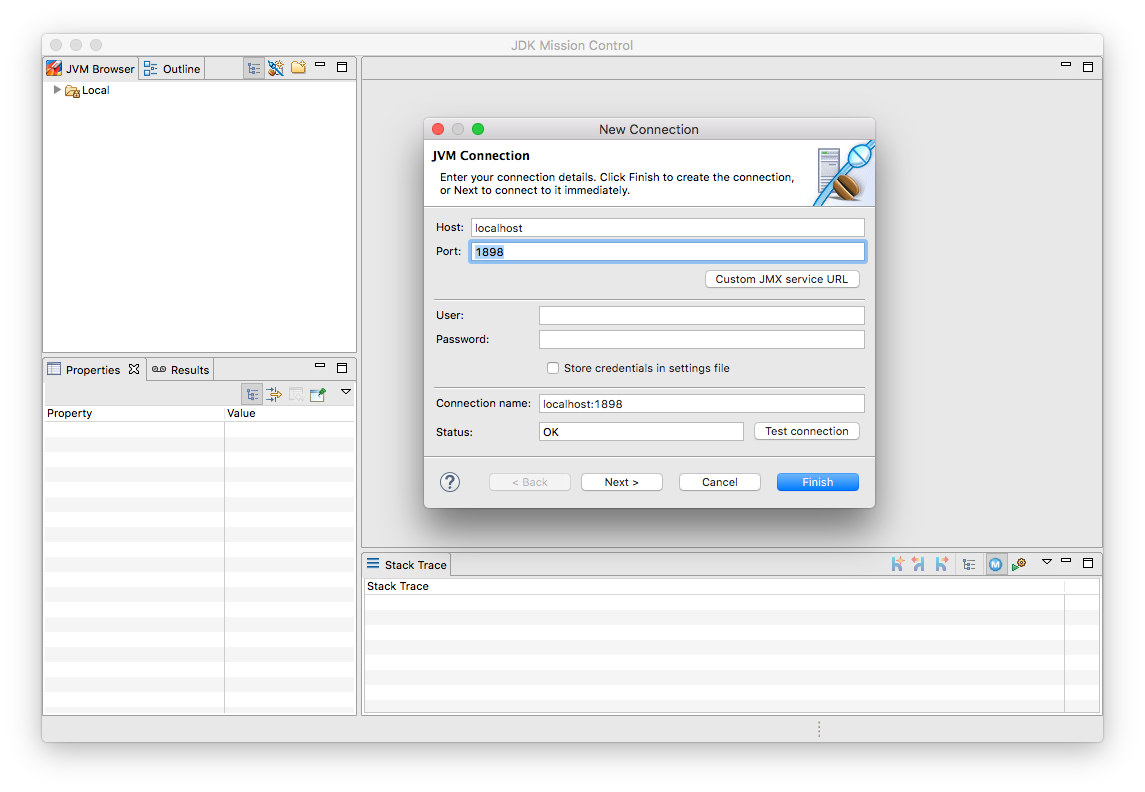
Now fire up Mission Control. The example service run via Docker Compose is configured so you can connect to it on localhost. In the JVM Browser, create a new connection with host "localhost" and port "1898". Hit "Test connection", which should yield "OK", then click "Finish".
Create a new recording by expanding the localhost:1898 node in the JVM Explorer, right-clicking on "Flight Recorder" and choosing "Start Flight Recording…". Confirm the default settings, which will create a recording with a duration of one minute. Go back to the Todo web application and perform a few tasks like creating some new todos, editing and deleting them, or filtering the todo list.
Either wait for the recording to complete or stop it by right-clicking on the recording name and selecting "Stop". Once the recording is done, it will be opened automatically. Now you could dive into all the logged events for the OS, the JVM etc, but as we’re interested in our custom JAX-RS events, Choose "Event Browser" in the outline view and expand the "JAX-RS" category. You will see the events for all your REST API invocations, including information such as duration of the request, the HTTP method, the resource path and much more:
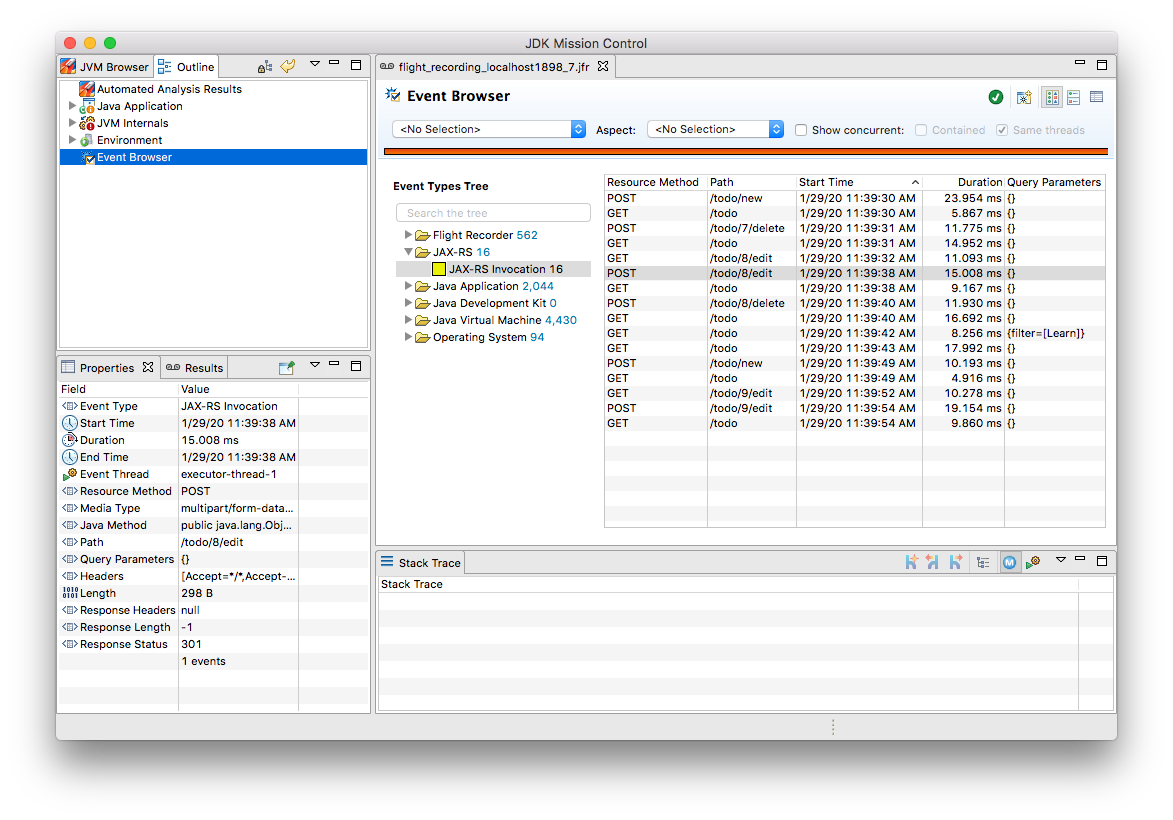
In a real-world use case, you could now use this information for instance to identify long-running requests and correlate these events with other data points in the Flight Recording, such as method profiling and memory allocation data, or sub-optimal SQL statements in your database.
|
If your application is running in production, it might not be feasible to connect to it via Mission Control from your local workstation. The jcmd utility comes in handy in that case; part of the JDK, you can use it to issue diagnostic commands against a running JVM. Amongst many other things, it allows you to start and stop Flight Recordings.
On the environment with your running application,
first run This will start a recording of 30 seconds, beginning in 5 seconds from now. Once the recording is done, you could copy the file to your local machine and load it into Mission Control for further analysis. To learn more about creating Flight Recordings via jcmd, refer to this great cheat sheet. |
Another useful tool in the belt is the jfr command, which was introduced in JDK 12. It allows you to filter and examine the binary Flight Recording files. You also can use it to extract parts of a recording and convert them to JSON, allowing them to be processed with other tools. E.g. you could convert all the JAX-RS events to JSON like so:
1
jfr print --json --categories JAX-RS my-recording.jfr
Event Settings
Sometimes it’s desirable to configure detailed behaviors of a given event type. For the JAX-RS invocation event it might for instance make sense to only log invocations of particular paths in a specific recording, allowing for a smaller recording size and keeping the focus on a particular subset of all invocations. JFR supports this by the notion of event settings. Such settings can be specified when creating a recording; based on the active settings, particular events will be included or excluded in the recording.
Inspired by the JavaDoc of @SettingDefinition let’s see what’s needed to enhance JaxRsInvocationEvent with that capability.
The first step is to define a subclass of jdk.jfr.SettingControl, which serves as the value holder for our setting:
 1
 2
 3
 4
 5
 6
 7
 8
 9
10
11
12
13
14
15
16
17
18
19
20
21
22
23
24
public class PathFilterControl extends SettingControl {

  private Pattern pattern = Pattern.compile(".*"); (1)

  @Override (2)
  public void setValue(String value) {
    this.pattern = Pattern.compile(value);
  }

  @Override (3)
  public String combine(Set<String> values) {
    return String.join("|", values);
  }

  @Override (4)
  public String getValue() {
    return pattern.toString();
  }

  (5)
  public boolean matches(String s) {
    return pattern.matcher(s).matches();
  }
}
| 1 | A regular expression pattern that’ll be matched against the path of incoming events; by default all paths are included (.*) |
| 2 | Invoked by the JFR runtime to set the value for this setting |
| 3 | Invoked when multiple recordings are running at the same time, combining the settings values |
| 4 | Invoked by the runtime for instance when getting the default value of the setting |
| 5 | Matches the configured setting value against a particular path |
On the event class itself a method with the following characteristics must be declared which will receive the setting by the JFR runtime:
 1
 2
 3
 4
 5
 6
 7
 8
 9
10
11
12
13
class JaxRsInvocationEvent extends Event {

  @Label("Path")
  public String path;

  // other members...

  @Label("Path Filter")
  @SettingDefinition (1)
  protected boolean pathFilter(PathFilterControl pathFilter) { (2)
    return pathFilter.matches(path);
  }
}
| 1 | Tags this as a setting |
| 2 | The method must be public, take a SettingControl type as its single parameter and return boolean |
This method will be invoked by the JFR runtime during the shouldCommit() call.
It passes in the setting value of the current recording so it can applied to the path value of the given event.
In case the filter returns true, the event will be added to the recording, otherwise it will be ignored.
We also could use such setting to control the inclusion or exclusion of specific event attributes.
For that, the setting definition method would always have to return true, but depending on the actual setting it might set particular attributes of the event class to null.
For instance this might come in handy if we wanted to log the entire request/response body of our REST API.
Doing this all the time might be prohibitive in terms of recording size, but it might be enabled for a particlar short-term recording for analyzing some bug.
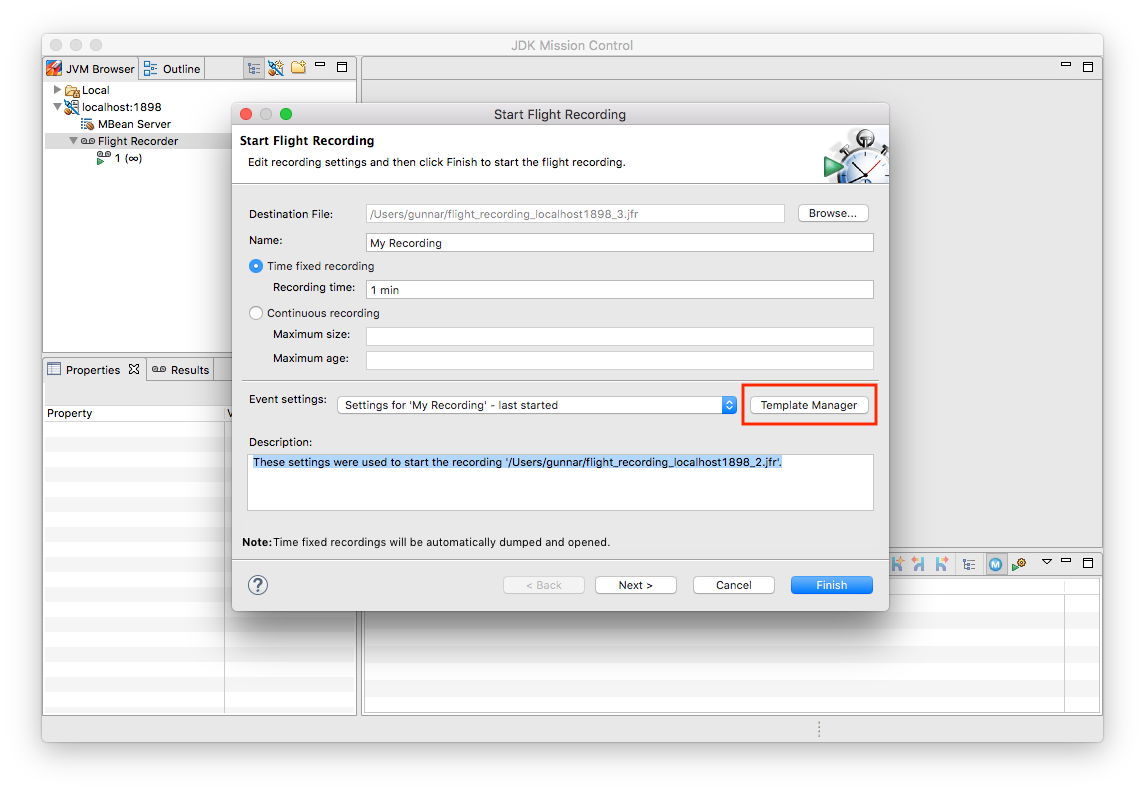
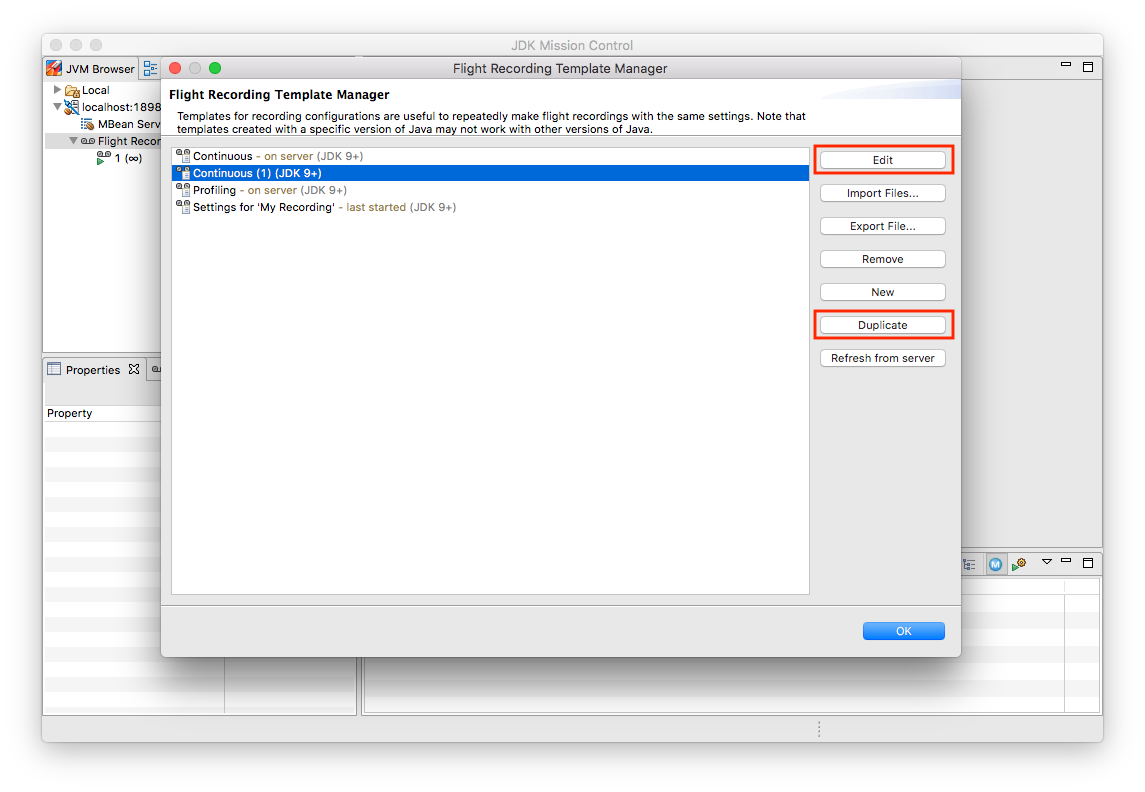
Now let’s see how the path filter can be applied when creating a new recording in Mission Control. The option is a bit hidden, but here’s how you can enable it. First, create a new Flight Recording, then choose "Template Manager" in the dialogue:
Duplicate the "Continuous" template and edit it:
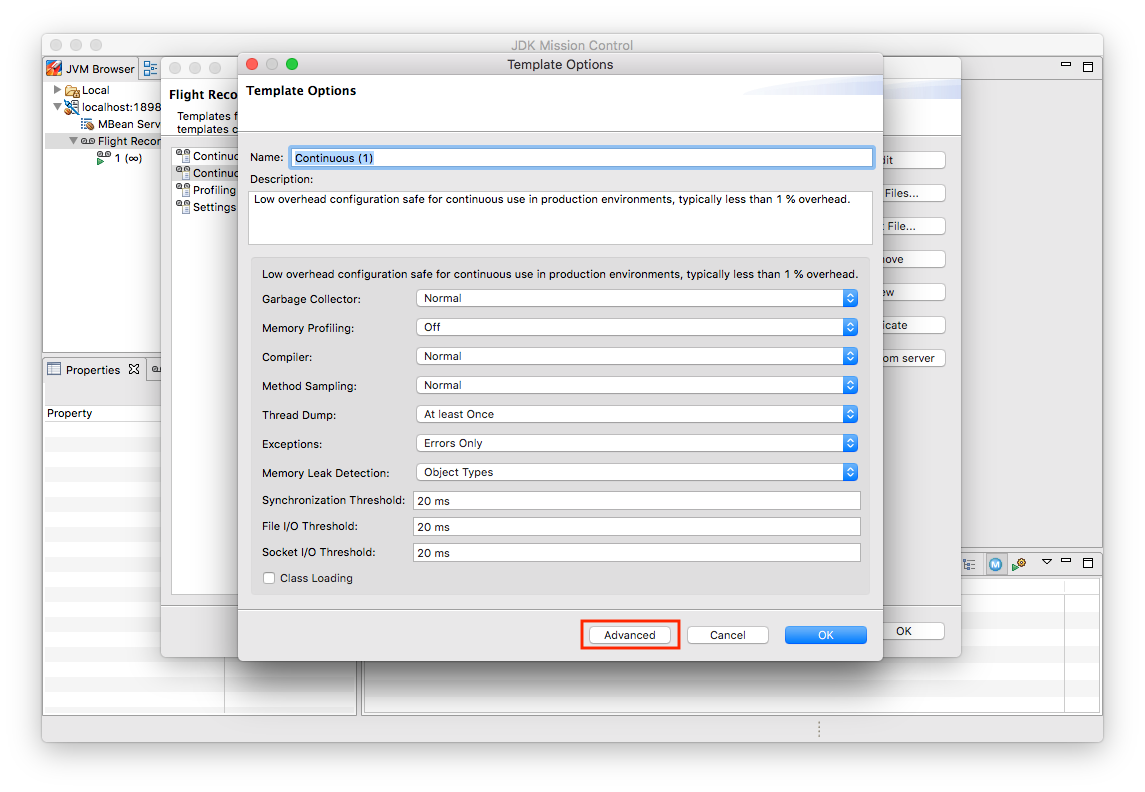
Click "Advanced":
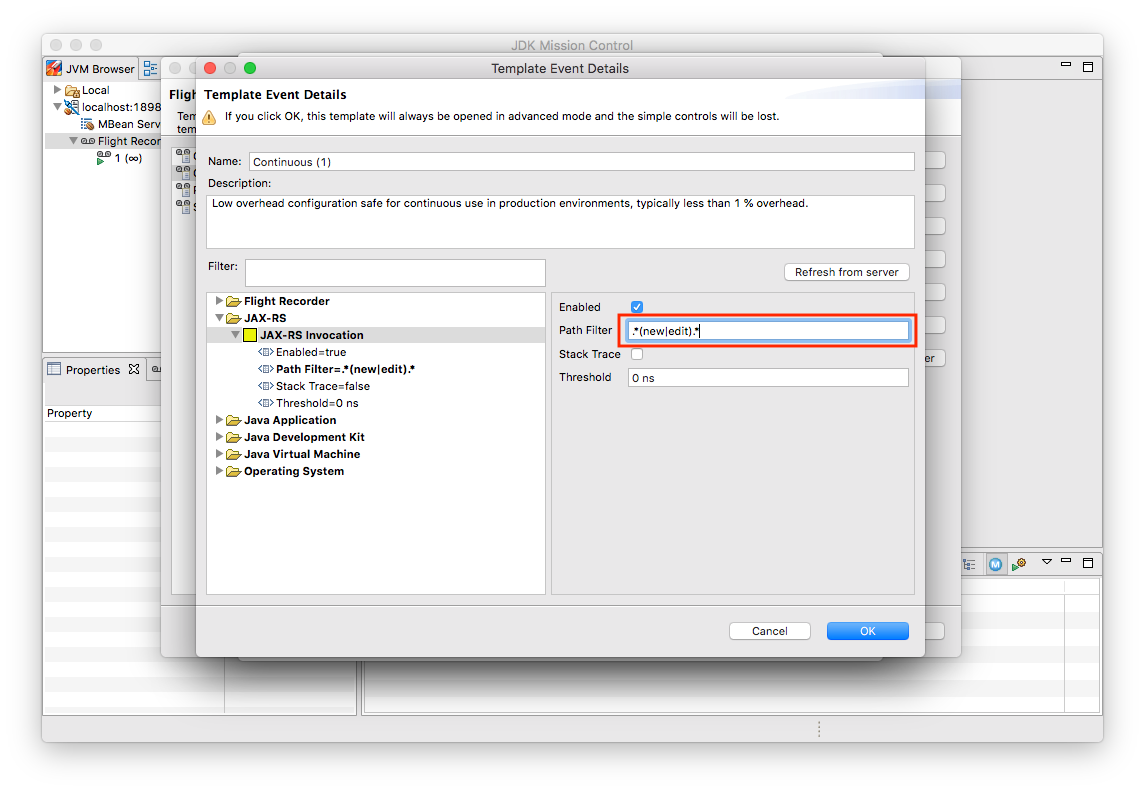
Expand "JAX-RS" → "JAX-RS Invocation" and put .*(new|edit).* into the Path Filter control:
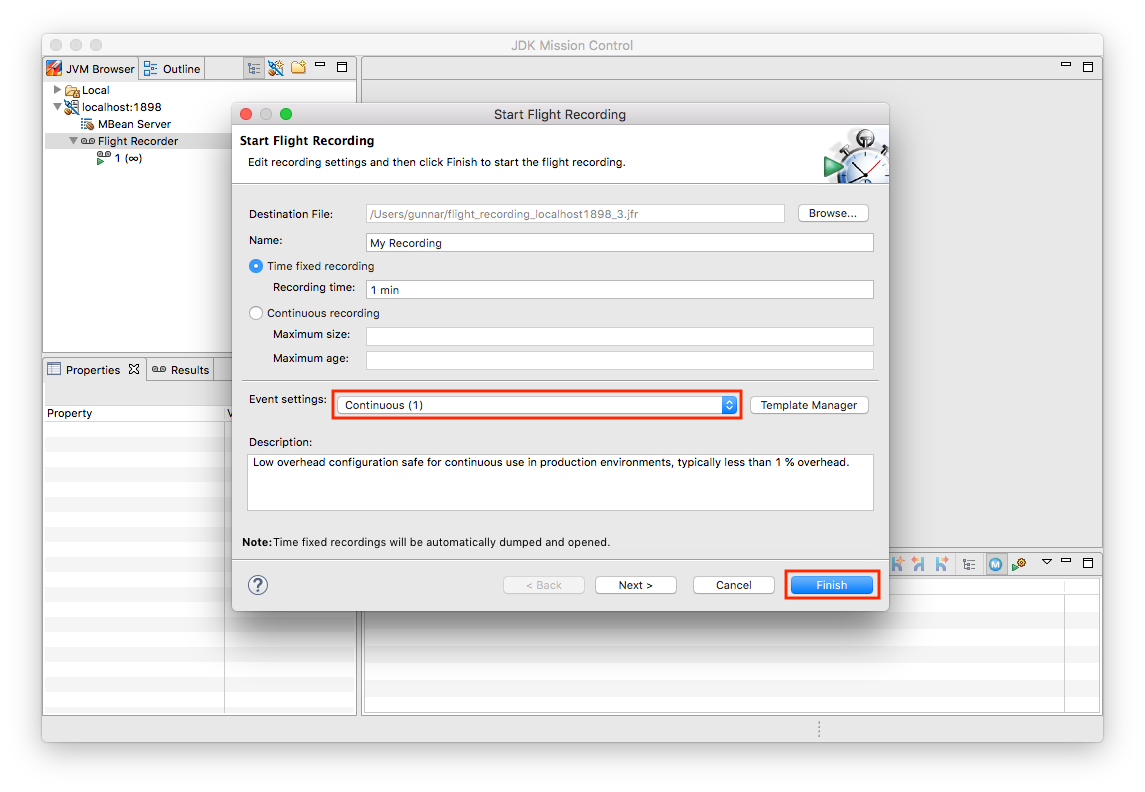
Now close the last two dialogues. In the "Start Flight Recording" dialogue make sure to select your new template under "Event Settings"; although you’ve edited it before, it won’t be selected automatically. I lost an hour or so wondering why my settings were not applied… .
Lastly, click "Finish" to begin the recording:
Perform some tasks in the Todo web app and stop the recording. You should see only the REST API calls for the new and edit operations, whereas no events should be shown for the list and delete operations of the API.
|
In order to apply specific settings when creating a recording on the CLI using jcmd,
edit the settings as described above.
Then go to the Template Manager and export the profile you’d like to use.
When starting the recording via jcmd, specify the settings file via the |
JFR Event Streaming
Flight Recorder files are great for analyzing performance characteristics in an "offline" approach: you can take recordings in your production environment and ship them to your work station or a remote support team, without requiring live access to the running application. This is also an interesting mode for open-source projects, where maintainers typically don’t have access to running applications of their users. Exchanging Flight Recordings (limited to a sensible subset of information, so to avoid exposure of confidential internals) might allow open source developers to gain insight into characteristics of their libraries when deployed to production at their users.
But there’s another category of use cases for event data sourced from applications, the JVM and the operating system, where the recording file approach doesn’t quite fit: live monitoring and alerting of running applications. E.g. operations teams might want to set up dashboards showing the most relevant application metrics in "real-time", without having to create any recording files first. A related requirement is alerting, so to be notified when metrics reach a certain threshold. For instance it might be desirable to be alterted if the request duration of our JAX-RS API goes beyond a defined value such as 100 ms.
This is where JEP 349 ("JFR Event Streaming") comes in. It’ll be part of Java 14 and its stated goal is to "provide an API for the continuous consumption of JFR data on disk, both for in-process and out-of-process applications". That’s exactly what we need for our monitoring/dashboarding use case. Using the Streaming API, Flight Recorder events of the running application can be exposed to external consumers, without having to explicitly load any recording files.
Now it may be prohibitively expensive to stream each and every event with all its detailed information to remote clients. But that’s not needed for monitoring purposes anyways. Instead, we can expose metrics based on our events, such as the total number and frequency of REST API invocations, or the average and 99th percentile duration of the calls.
MicroProfile Metrics
The following shows a basic implementation of exposing these metrics for the JAX-RS API events to Prometheus/Grafana, where they can be visualized using a dashboard. Being based on Quarkus, the Todo web application can leverage all the MicroProfile APIs. On of them is the MicroProfile Metrics API, which defines a "unified way for Microprofile servers to export Monitoring data ("Telemetry") to management agents".
While the MicroProfile Metrics API is used in an annotation-driven fashion often-times, it also provides a programmatic API for registering metrics. This can be leveraged to expose metrics based on the JAX-RS Flight Recorder events:
 1
 2
 3
 4
 5
 6
 7
 8
 9
10
11
12
13
14
15
16
17
18
19
20
21
22
23
24
25
26
27
28
29
30
31
32
33
34
35
36
37
38
39
40
41
42
43
44
45
46
47
@ApplicationScoped
public class Metrics {

  @Inject (1)
  MetricRegistry metricsRegistry;

  private RecordingStream recordingStream; (2)

  public void onStartup(@Observes StartupEvent se) {
    recordingStream = new RecordingStream();  (3)
    recordingStream.enable(JaxRsInvocationEvent.NAME);

    recordingStream.onEvent(JaxRsInvocationEvent.NAME, event -> {  (4)

      String path = event.getString("path")
          .replaceAll("(\\/)([0-9]+)(\\/?)", "$1{param}$3"); (5)
      String method = event.getString("method");
      String name = path + "-" + method;

      Metadata metadata = metricsRegistry.getMetadata().get(name);
      if (metadata == null) {
        metricsRegistry.timer(Metadata.builder() (6)
            .withName(name)
            .withType(MetricType.TIMER)
            .withDescription("Metrics for " + path +
                " (" + method + ")")
            .build()).update(event.getDuration().toNanos(),
                TimeUnit.NANOSECONDS);
      }
      else { (7)
        metricsRegistry.timer(name).update(event.getDuration()
            .toNanos(), TimeUnit.NANOSECONDS);
      }
    });
    recordingStream.startAsync(); (8)
  }

  public void stop(@Observes ShutdownEvent se) {
    recordingStream.close(); (9)
    try {
      recordingStream.awaitTermination();
    }
    catch (InterruptedException e) {
      throw new RuntimeException(e);
    }
  }
}
| 1 | Inject the MicroProfile Metrics registry |
| 2 | A stream providing push access to JFR events |
| 3 | Initialize the stream upon application start-up, so it includes the JAX-RS invocation events |
| 4 | For each JaxRsInvocationEvent this callback will be invoked |
| 5 | To register a corresponding metric, any path parameters are replaced with a constant placeholder, so that e.g. all invocations of the todo/{id}/edit path are exposed via one single metric instead of having separate ones for Todo 1, Todo 2 etc. |
| 6 | If the metric for the specific path hasn’t been registered yet, then do so; it’s a metric of type TIMER, allowing metric consumers to track the duration of calls of that particular path |
| 7 | If the metric for the path has been registered before, update its value with the duration of the incoming event |
| 8 | Start the stream asynchronously, not blocking the onStartup() method |
| 9 | Close the JFR event stream upon application shutdown |
When connecting to the running application using JMC now, you’ll see a continuous recording, which serves as the basis for the event stream.
It only contains events of the JaxRsInvocationEvent type.
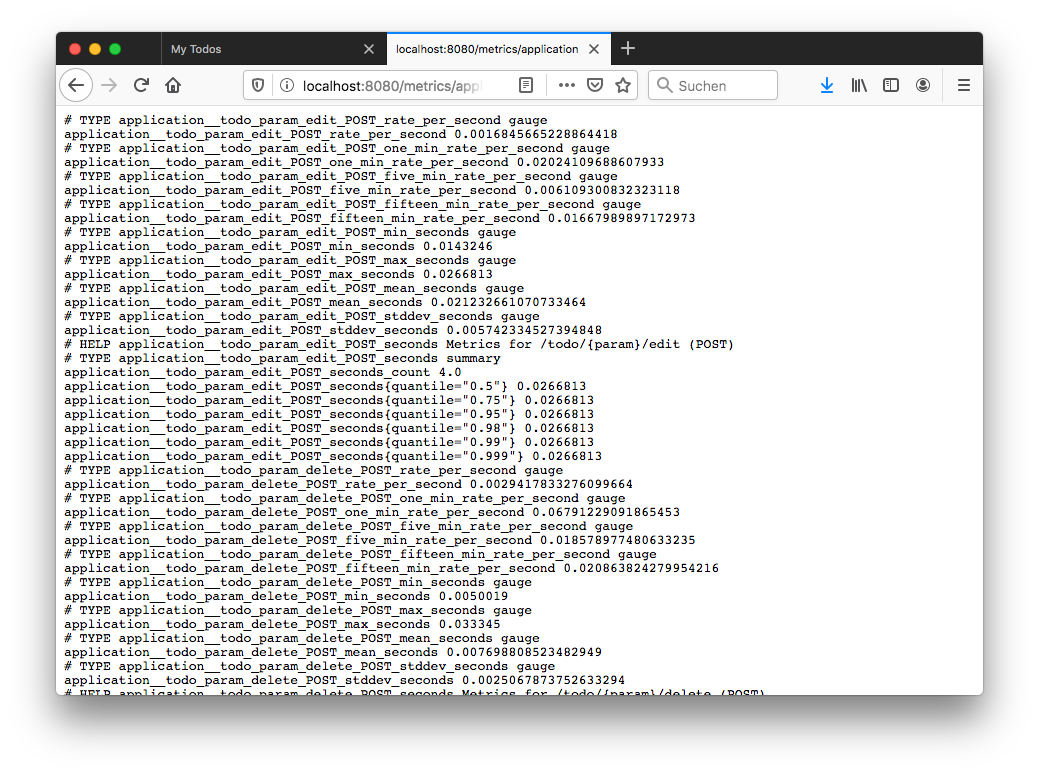
MicroProfile Metrics exposes any application-provided metrics in the Prometheus format under the /metrics/application endpoint;
for each operation of the REST API, e.g. POST to /todo/{id}/edit, the following metrics are provided:
-
request rate per second, minute, five minutes and 15 minutes
-
min, mean and max duration as well as standard deviation
-
total invocation count
-
duration of 75th, 95th, 99th etc. percentiles
Once the endpoint is provided, it’s not difficult to set up a scraping process for ingesting the metrics into the Prometheus time-series database. You can find the required Prometheus configuration in the accompanying source code repository.
While Prometheus provides some visualization capabilities itself, it is often used together with Grafana, which allows to build nicely looking dashboards via a rather intuitive UI. Here’s an example dashboard showing the duration and invocation numbers for the different methods in the Todo REST API:
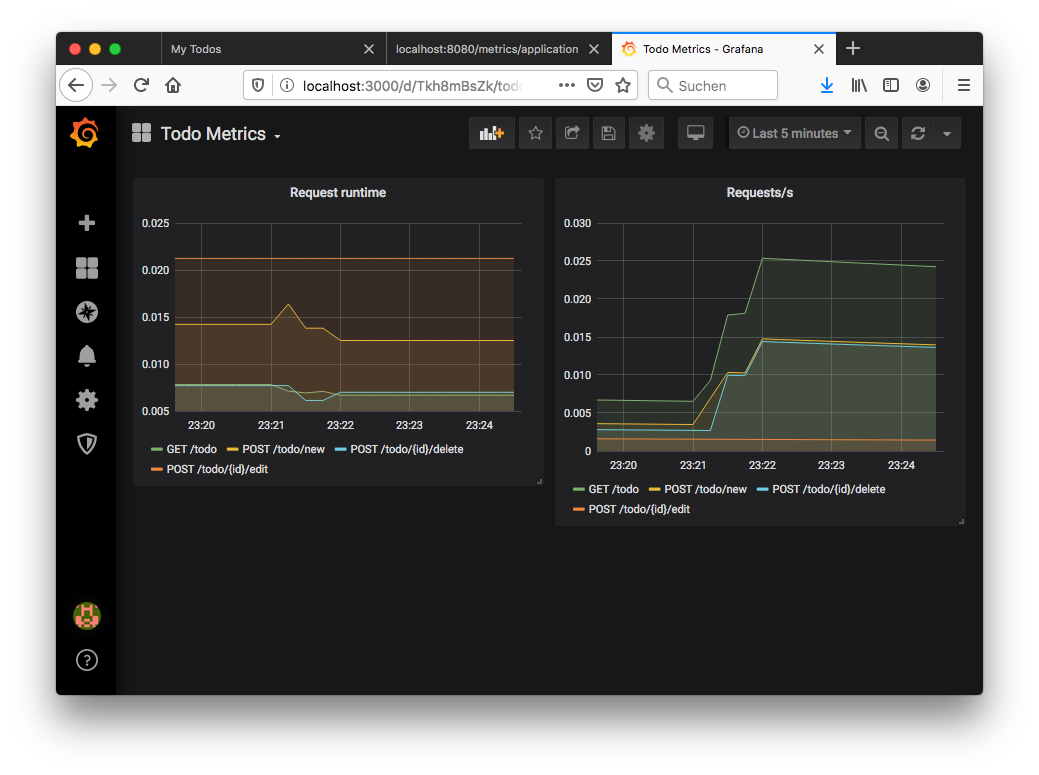
Again you can find the complete configuration for Grafana including the definition of that dashboard in the example repo. It will automatically be loaded when using the Docker Compose set-up shown above. Based on that you could easily expand the dashboard for other metrics and set up alerts, too.
Combining the monitoring of live key metrics with the deep insights possible via detailed JFR recordings enable a very powerful workflow for analysing performance issues in production:
-
When setting up the continuous recording that serves as the basis for the metrics, have it contain all the event types you’d need to gain insight into GC or memory issues etc.; specify a maximum size via
RecordingStream#setMaxSize(), so to avoid an indefinitely growing recording; you’ll probably need to experiment a bit to find the right trade-off between number of enabled events, duration that’ll be covered by the recording and the required disk space -
Only expose a relevant subset of the events as metrics to Prometheus/Grafana, such as the JAX-RS API invocation events in our example
-
Set up an alert in Grafana on the key metrics, e.g. mean duration of the REST calls, or 99th percentile thereof
-
If the alert triggers, take a dump of the last N minutes of the continuous recording via JMC or jcmd (using the
JFR.dumpcommand), and analyze that detailed recording to understand what was happening in the time leading to the alert
Summary and Related Work
Flight Recorder and Mission Control are excellent tools providing deep insight into the performance characteristics of Java applications. While there’s a large amount of data and highly valuable information provided out the box, JFR and JMC also allow for the recording of custom, application-specific events. With its low overhead, JFR can be enabled on a permanent basis in production environments. Combined with the Event Streaming API introduced in Java 14, this opens up an attractive, very performant alternative to other means of capturing analysis information at application runtime, such as logging libraries. Providing live key metrics derived from JFR events to tools such as Prometheus and Grafana enables monitoring and alerting in "real-time".
For many enterprises that are still on Java 11 or even 8, it’ll still be far out into the future until they might adopt the streaming API. But with more and more companies joining the OpenJDK efforts, it might be a possiblity that this useful feature gets backported to earlier LTS releases, just as the open-sourced version of Flight Recorder itself got backported to Java 8.
There are quite a few posts and presentations about JFR and JMC available online, but many of them refer to older versions of those tools, before they got open-sourced. Here are some up-to-date resources which I found very helpful:
-
Continuous Monitoring with JDK Flight Recorder: a talk from QCon SF 2019 by Mikael Vidstedt
-
Flight Recorder & Mission Control at Code One 2019: a compilation of several great sessions on these two tools at last year’s Code One, put together by Marcus Hirt
-
Digging Into Sockets With Java Flight Recorder: blog post by Petr Bouda on identifying performance bottlenecks with JFR in a Netty-based web application
Lastly, the Red Hat OpenJDK team is working on some very interesting projects around JFR and JMC, too. E.g. they’ve built a datasource for Grafana which lets you examine the events of a JFR file. They also work on tooling to simplify the usage of JFR in container-based environments such as Kubernetes and OpenShift, including a K8s Operator for controlling Flight Recordings and a web-based UI for managing JFR in remote JVMs. Should you happen to be at the FOSDEM conference in Brussels on the next weekend, be sure to not miss the JMC & JFR - 2020 Vision session by Red Hat engineer Jie Kang.
If you’d like to experiment with JDK Flight Recorder and JDK Mission Control based on the Todo web application yourself, you can find the complete source code for this post on GitHub.
Many thanks to Mario Torre and Jie Kang for reviewing an early draft of this post.