
I’m excited to share the news about an open-source utility I’ve been working on lately: JmFrX, a tool for capturing JMX data with JDK Flight Recorder.
When using JMX (Java Management Extensions), The Java platform’s standard for monitoring and managing applications, JmFrX allows you to periodically record the attributes from any JMX MBean into JDK Flight Recorder (JFR) files, which you then can analyse using JDK Mission Control (JMC).
This is useful for a number of reasons:
-
You can track changes to the values of JMX MBean attributes over time without resorting to external monitoring tools
-
You can analyze JMX data from offline JFR recording files in cases where you cannot directly connect to the running application
-
You can export JMX data as live data streams using the JFR event streaming API introduced in Java 14
In this blog post I’m going to explain how to use JmFrX for recording JMX data in your applications, point out some interesting JmFrX implemention details, and lastly will discuss some potential steps for future development of the tool.
Why JmFrX?
JDK Flight Recorder is a "low-overhead data collection framework for troubleshooting Java applications and the HotSpot JVM". In combination with the JDK Mission Control client application it allows to gain deep insights into the performance characteristics of Java applications.
In addition to the built-in metrics and event types, JFR also allows to define and emit custom event types. JFR got open-sourced in JDK 11; since then, developers in the Java eco-system began to support this, enabling users to work with JFR and JMC for analyzing the runtime behavior of 3rd party libraries and frameworks. For instance, JUnit 5.7 produces JFR events related to the execution lifecycle of unit tests.
At the same time, many library authors are not (yet) in a position where they could easily emit JFR events from their tools, as for instance they might wish to keep compatibility with older Java versions. They might already expose JMX MBeans though which often provide fine-grained information about the execution state of Java applications. This is where JmFrX comes in: by periodically capturing the attribute values from a given set of JMX MBeans, it allows to capture this information in JFR recordings.
JmFrX isn’t the first effort that seeks to bridge JMX and JFR; JDK Mission Control project lead Marcus Hirt discusses a similar project in a blog post in 2016. But unlike the implementation described by Marcus in this post, JmFrX is based on the public and supported APIs for defining, configuring and emitting JFR events, as available since OpenJDK 11.
How To Use JmFrX
In order to use JmFrX, make sure to run OpenJDK 11 or newer. OpenJDK 8 also contains the open-sourced Flight Recorder bits as of release 8u262 (from July this year); so this should work, too, but I haven’t tested it yet.
Until a stable release will be provided, you can obtain JmFrX snapshot builds via JitPack. For that, add the JitPack repository to your pom.xml when using Apache Maven (or apply equivalent configuration for your preferred build tool):
1
2
3
4
5
6
7
8
...
<repositories>
  <repository>
    <id>jitpack.io</id>
    <url>https://jitpack.io</url>
  </repository>
</repositories>
...
Then add the JmFrX dependency:
1
2
3
4
5
6
7
...
<dependency>
  <groupId>com.github.gunnarmorling</groupId>
  <artifactId>jmfrx</artifactId>
  <version>master-SNAPSHOT</version>
</dependency>
...
The next step is registering the JmFrX event type with JFR in the start-up routine of your program.
This could for instance be done in the main() method, the static initializer of a class loaded early on, an eagerly initialized Spring or CDI bean, etc.
A Java agent for this purpose will be provided as part of this project soon.
When building applications with Quarkus, you could use an application start-up event like so:
 1
 2
 3
 4
 5
 6
 7
 8
 9
10
11
@ApplicationScoped
public class EventRegisterer {

  public void registerEvent(@Observes StartupEvent se) {
    Jmfrx.getInstance().register();
  }

  public void unregisterEvent(@Observes ShutdownEvent se) {
    Jmfrx.getInstance().unregister();
  }
}
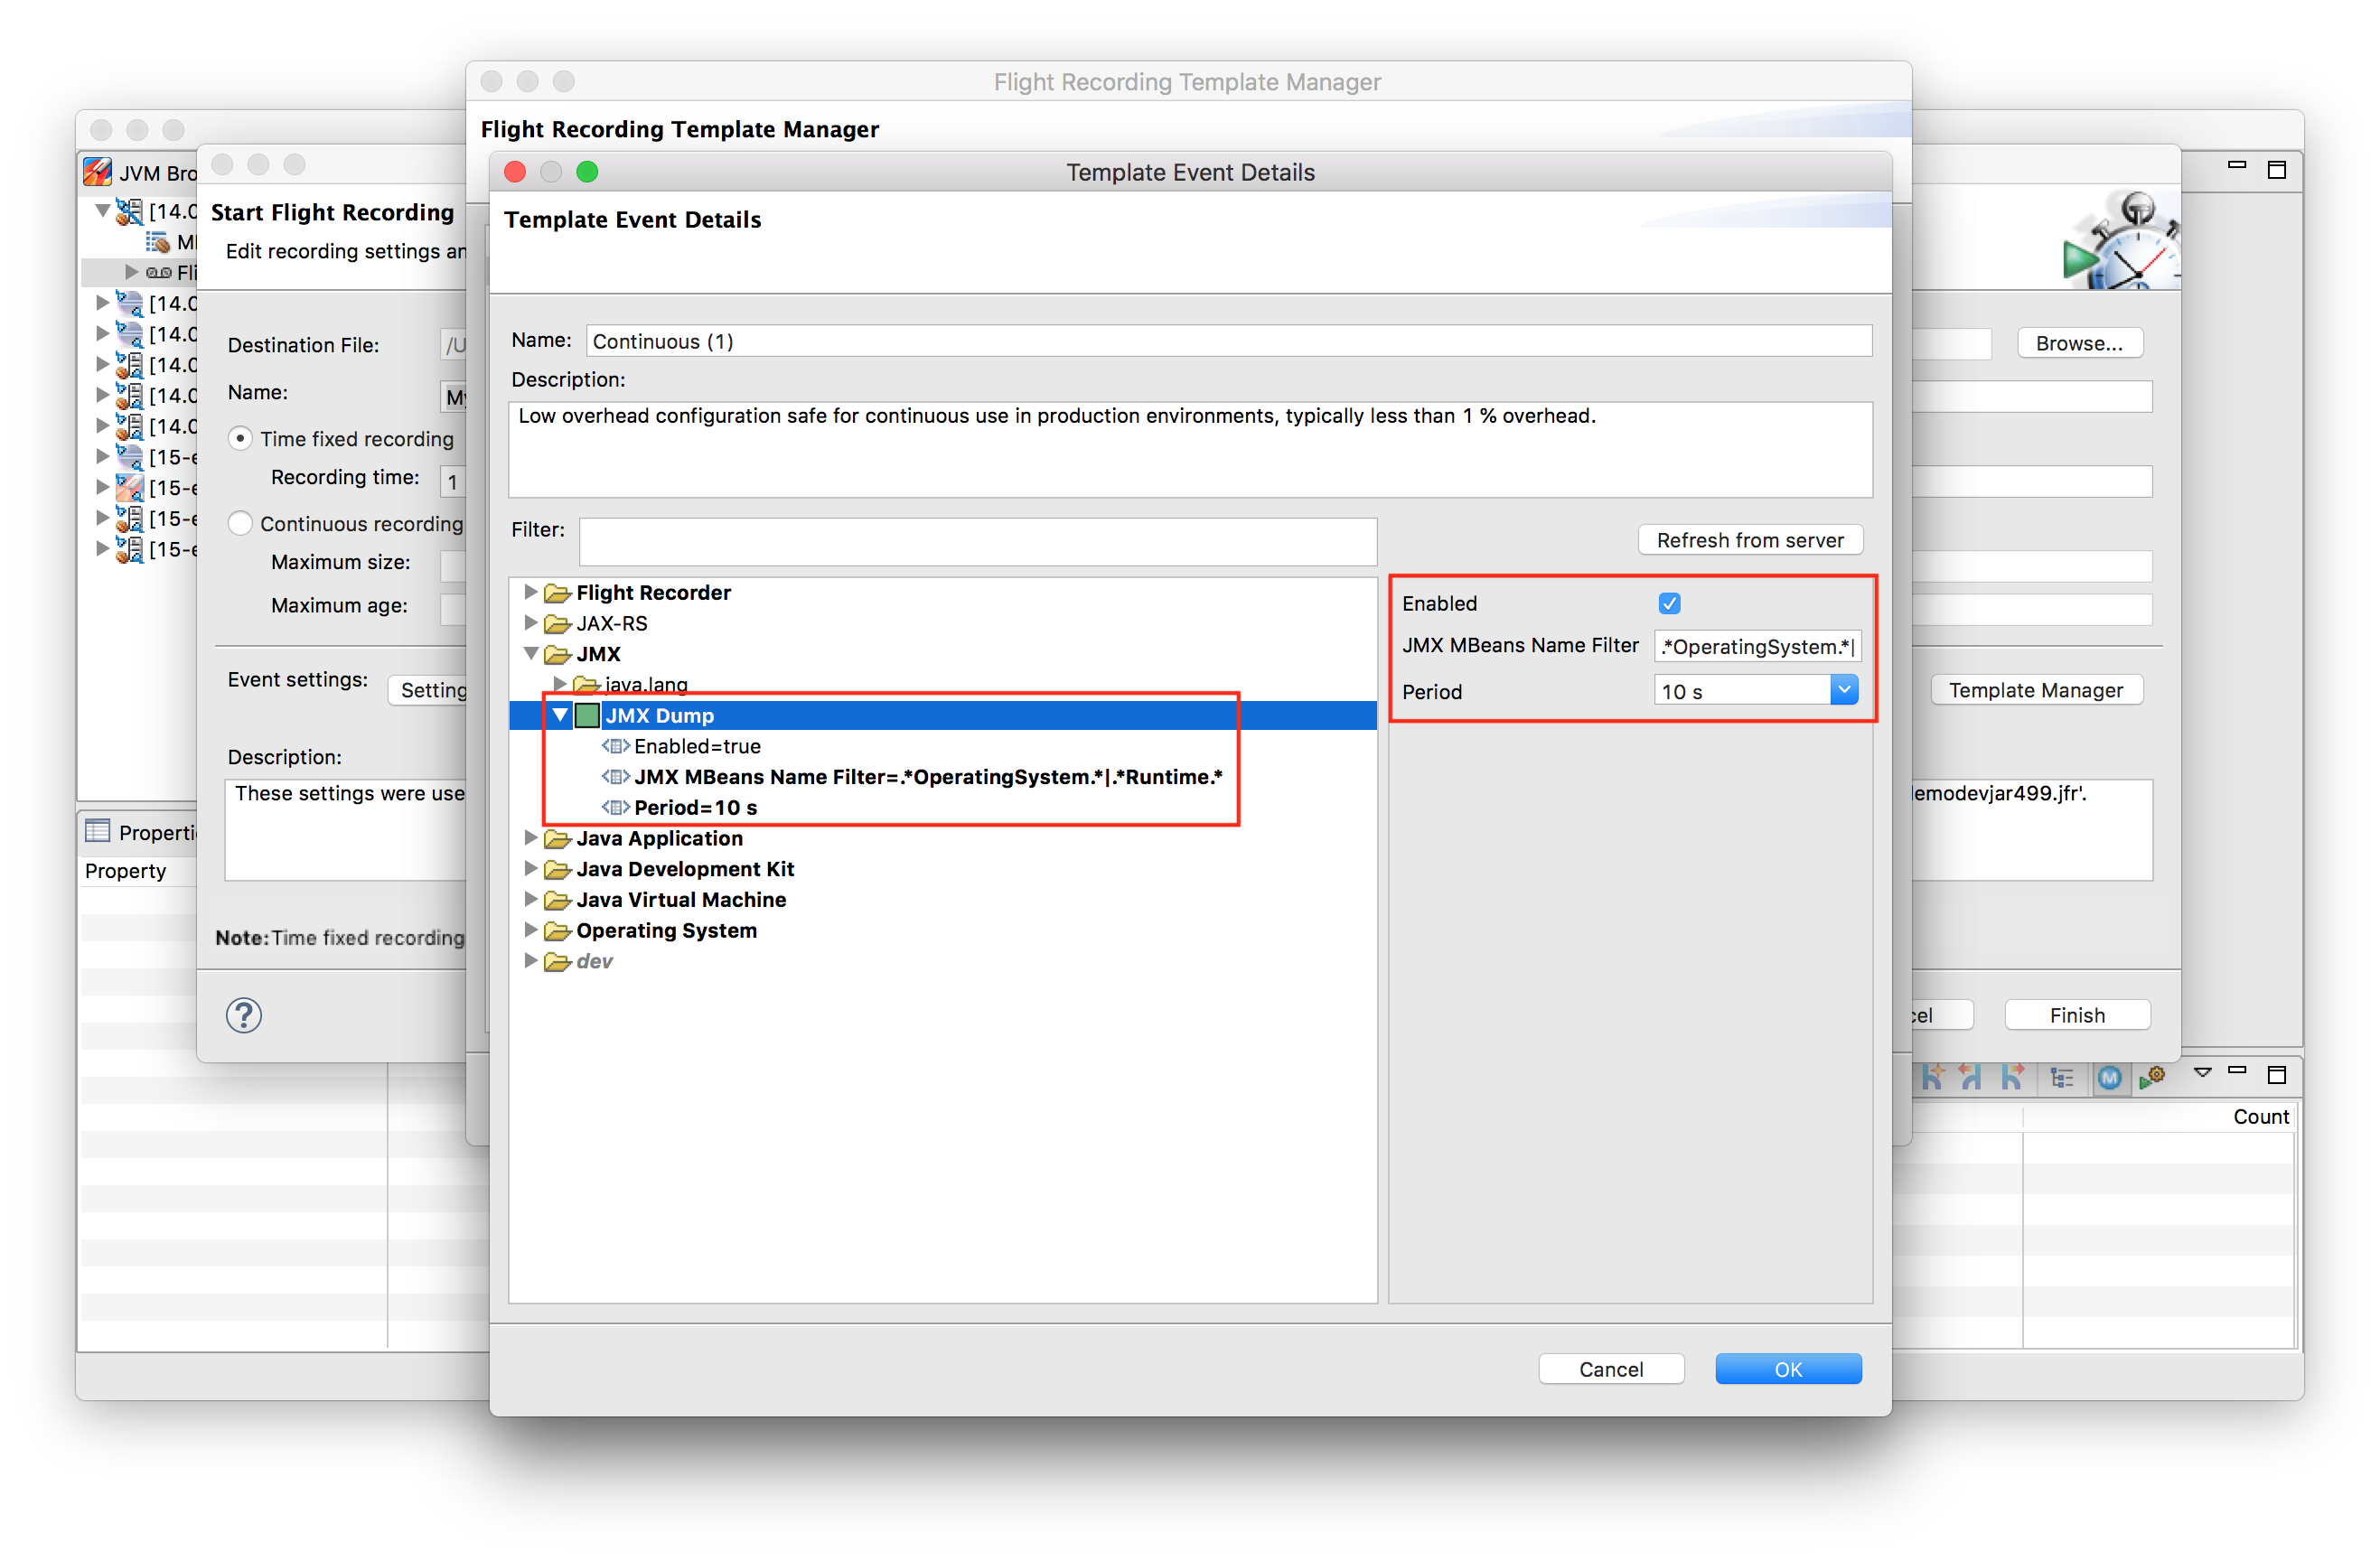
Now start your application and create a JFR configuration file which enables the JmFrX event type. To do so, open JDK Mission Control, and choose your running application in the JVM Browser. Then perform these steps:
-
Right-click the target JVM → Select Start Flight Recording…
-
Click on Template Manager
-
Copy the Continuous setting and click Edit for modifying this copy
-
Expand the JMX and JMX Dump nodes
-
Make sure the JMX Dump event type is Enabled; choose a period for dumping the chosen JMX MBeans (by default 60 s) and specify the MBeans whose data should be captured; that’s done by means of a regular expression, which matches one or more JMX object names, for instance
.*OperatingSystem.*:
-
Close the two last dialogues by clicking OK and OK
-
Important: Make sure that the template you edited is selected under Event settings
-
Click Finish to begin the recording
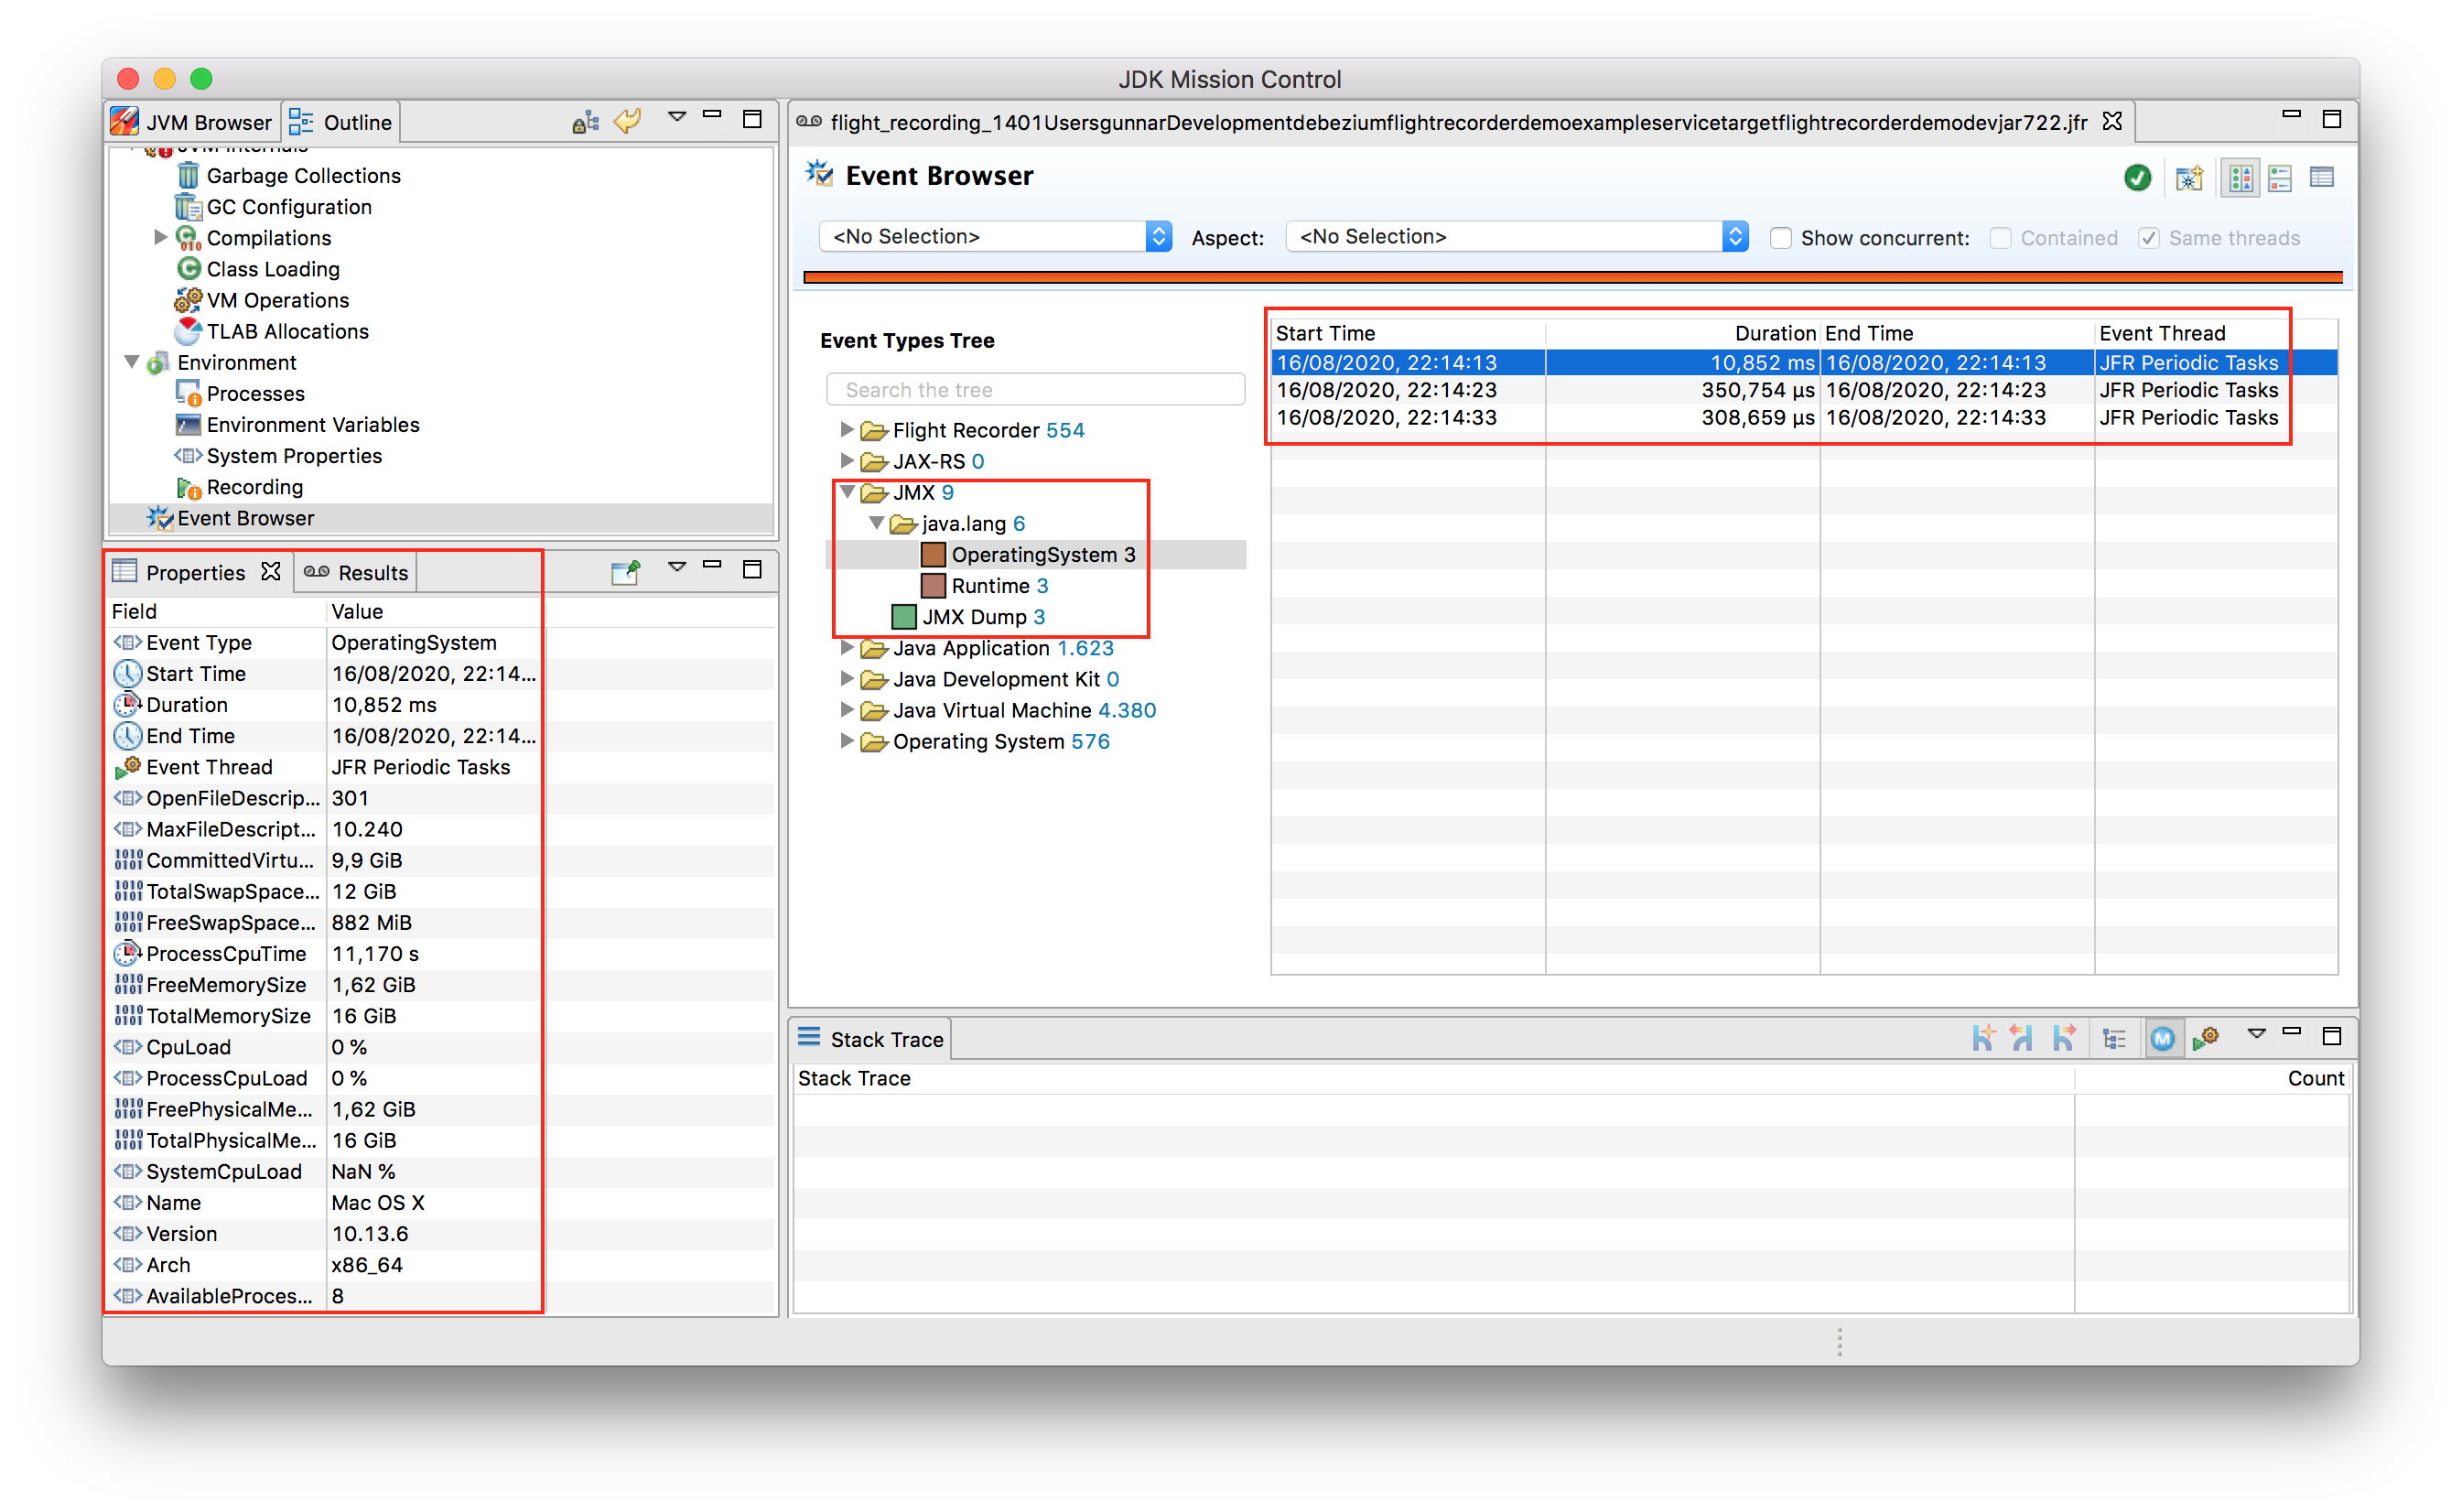
Once the recording is complete, open the recording file in JDK Mission Control and go to the Event Browser. You should see periodic events corresponding to the selected MBeans under the JMX node:
When not using JDK Mission Control to initiate recordings, but the jcmd utility on the command line, also follow the same steps as above for creating a configuration as described above. But then, instead of starting the recording, export the configuration file from the template manager and specify its name to jcmd via the settings=/path/to/settings.jfc parameter.
Now using JmFrX to observe JMX data from for the java.lang MBeans like Runtime and OperatingSystem in JFR isn’t too exciting yet,
as there’s dedicated JFR event types which contain most of that information.
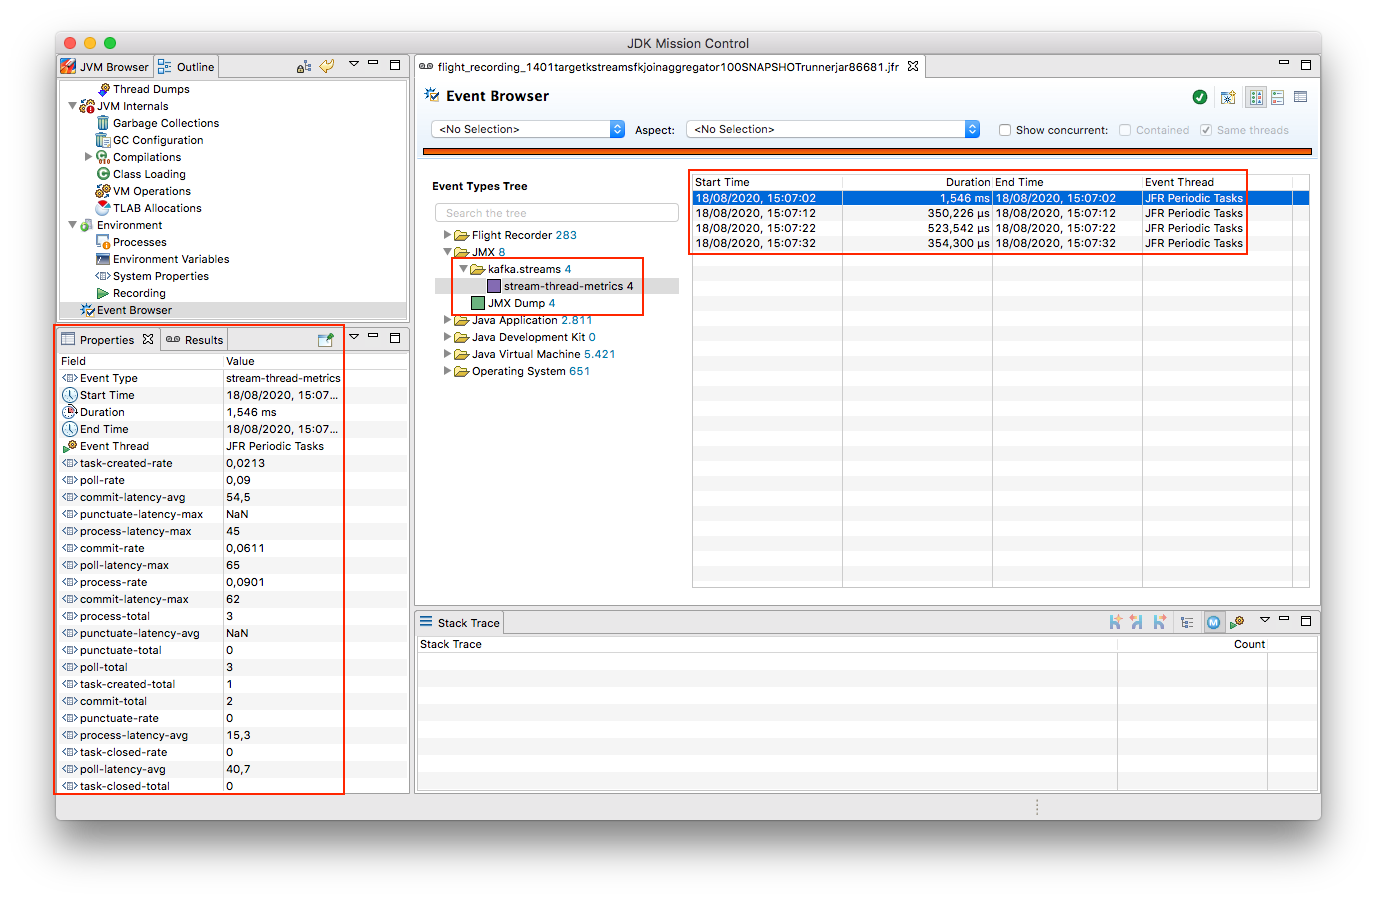
But things get more interesting when capturing data from custom MBean types, as e.g. here for the stream threads metrics from a Kafka Streams application:
Customizing Event Formats
By default, JmFrX will propagate the raw attribute values from a JMX MBean to the corresponding JFR event. This makes sure that all the information can be retrieved from recordings, but the data format can be a bit unwieldy, e.g. when it comes to data amounts in bytes, or time periods in milli-seconds since epoch.
To address this, JFR supports a range of metadata annotations such as @DataAmount, @Timespan, or @Percentage, which allow to format event attributes.
This information then is used by JMC for instance when displaying events in the browser (see event Properties to the left in the screenshot above).
JmFrX integrates with this metadata facility via the notion of event profiles,
which describe the data format of one MBean type and its attributes.
When creating an event for a given JMX MBean, JmFrX will look for a corresponding event profile and apply its settings.
Event profiles are defined by implementing the EventProfileContributor SPI.
As an example here’s a subset of the the built-in profile definition for the OperatingSystem MBean:
 1
 2
 3
 4
 5
 6
 7
 8
 9
10
11
12
13
14
15
16
17
18
19
20
21
22
23
24
public class JavaLangEventProfileContributor implements
    EventProfileContributor {

  @Override
  public void contributeProfiles(EventProfileBuilder builder) {
    builder.addEventProfile("java.lang:type=OperatingSystem")          (1)
        .addAttributeProfile("TotalSwapSpaceSize", long.class,
            new AnnotationElement(DataAmount.class, DataAmount.BYTES), (2)
            v -> v)
        .addAttributeProfile("FreeSwapSpaceSize", long.class,
            new AnnotationElement(DataAmount.class, DataAmount.BYTES),
            v -> v)                                                    (3)
        .addAttributeProfile("CpuLoad", double.class,
            new AnnotationElement(Percentage.class),
            v -> v)
        .addAttributeProfile("ProcessCpuLoad", double.class,
            new AnnotationElement(Percentage.class), v -> v)
        .addAttributeProfile("SystemCpuLoad", double.class,
            new AnnotationElement(Percentage.class), v -> v)
        .addAttributeProfile("ProcessCpuTime", long.class,
            new AnnotationElement(Timespan.class, Timespan.NANOSECONDS),
            v -> v );
    }
}
| 1 | Profiles are linked via the MBean name |
| 2 | The atribute type is specified via an AnnotationElement for one of the JFR type metadata annotations |
| 3 | If needed, the actual value can be modified too, e.g. to convert it into another data type, or to shift its value into an expected range (for instance 0 to 1 for percentage values) |
Once you’ve defined the event profiles for your MBean type(s), don’t forget to register the contributor type either as a service implementation in your module-info.java descriptor (when building a modular Java application):
1
2
3
4
5
6
module com.example {
    requires jdk.jfr;
    requires dev.morling.jmfrx;
    provides dev.morling.jmfrx.spi.EventProfileContributor
        with com.example.MyEventProfileContributor;
}
When building an application using the traditional classpath, register the names of all profile contributors in the META-INF/services/dev.morling.jmfrx.spi.EventProfileContributor file.
There’s a small (yet hopefully growing) set of event profiles built into JmFrX. But as event profile contributors are discovered using the Java service loader mechanism, you can also easily plug in event profiles for other MBean types, e.g. for the JMX MBeans of Apache Kafka or Kafka Connect, or application servers like WildFly.
Also your pull requests for contributing event profiles for common JMX applications to JmFrX itself will be very welcomed!
How It Works
If you solely want to use JmFrX, you can pretty much stop reading this post at this point. But if you’re curious about how it is working internally, stay with me for a bit longer: JmFrX uses two lesser known JFR features which also might be interesting for your own application-specific event types, periodic JFR events and dynamic event types.
Unlike most JFR event types which are emitted when some specific JVM or application functionality is executed,
periodic events are produced in a regular interval.
The default interval (which can be overridden by the user) is specified using the @Period annotation on the event type definition:
 1
 2
 3
 4
 5
 6
 7
 8
 9
10
11
12
@Name(JmxDumpEvent.NAME)
@Label("JMX Dump")
@Category("JMX")
@Description("Periodically dumps specific JMX MBeans")
@StackTrace(false)
@Period("60 s")
public class JmxDumpEvent extends Event {

  public static final String NAME = "dev.morling.jmfrx.JmxDumpEvent";

  // event implementation ...
}
Upon application start-up, JmFrX registers this event type with the JFR environment:
 1
 2
 3
 4
 5
 6
 7
 8
 9
10
11
12
13
14
15
16
17
18
19
20
21
22
23
24
25
...
private Runnable hook;

public void register() {
  hook = () -> {                                             (1)
    JmxDumpEvent dumpEvent = new JmxDumpEvent();

    if (!dumpEvent.isEnabled()) {
      return;
    }

    dumpEvent.begin();

    // retrieve data from matching MBean(s) and create event(s) ...

    dumpEvent.commit();
  };

  FlightRecorder.addPeriodicEvent(JmxDumpEvent.class, hook); (2)
}

public void unregister() {
  FlightRecorder.removePeriodicEvent(hook);                  (3)
}
...
| 1 | The event hook implementation |
| 2 | Register the periodic event |
| 3 | Unregister the periodic event |
The regular expression for specifying the MBean name(s) is passed to the event type as a SettingControl.
You can learn more about event settings in my post on custom JFR event types.
When the periodic event hook runs, it must create one event for each captured MBean. As JmFrX cannot know which MBean(s) you’re interested in, it’s not an option to pre-define these event types and their structure.
This is where dynamic JFR event types come in:
Using the EventFactory class, event types can be defined at runtime.
Under the covers, JFR will create a corresponding Event sub-class dynamically using the ASM API.
Here’s the relevant JmFrX code which defines the event type for a given MBean:
 1
 2
 3
 4
 5
 6
 7
 8
 9
10
11
12
13
14
15
16
17
18
19
20
21
22
23
24
25
26
27
28
29
30
31
...
public static EventDescriptor getDescriptorFor(String mBeanName) {
  MBeanServer mbeanServer = ManagementFactory.getPlatformMBeanServer();

  try {
    ObjectName objectName = new ObjectName(mBeanName);
    MBeanInfo mBeanInfo = mbeanServer.getMBeanInfo(objectName);

    List<AnnotationElement> eventAnnotations = Arrays.asList( (1)
        new AnnotationElement(Category.class, getCategory(objectName)),
        new AnnotationElement(StackTrace.class, false),
        new AnnotationElement(Name.class, getName(objectName)),
        new AnnotationElement(Label.class, getLabel(objectName)),
        new AnnotationElement(Description.class,
            mBeanInfo.getDescription())
    );

    List<AttributeDescriptor> fields = getFields(objectName, mBeanInfo);

    List<ValueDescriptor> valueDescriptors = fields.stream() (2)
        .map(AttributeDescriptor::getValueDescriptor)
        .collect(Collectors.toList());

    return new EventDescriptor(EventFactory.create(eventAnnotations,
        valueDescriptors), fields);
  }
  catch (Exception e) {
    throw new RuntimeException(e);
  }
}
...
| 1 | Define event metadata like name, label, category etc. via the JFR metadata annotations |
| 2 | For each MBean attribute, an attribute is added to the event type; its definition is based on the information in the corresponding event profile, if present |
The actual implemention is slightly more complex, as it deals with integrating metadata from JmFrX event profiles and more.
You can find the complete code in the EventProfile class.
Takeaways
JmFrX is a small utility which allows you to capture JMX data with JDK Flight Recorder. It’s open-source (Apache License, version 2), you can find the source code on GitHub. With the wide usage of JMX for application monitoring in the Java world, JmFrX can help to bring that information into JFR recordings, making it available for offline investigations and analyses.
Potential next steps for JmFrX include more meaningful handling of tabular and composite JMX data, adding a Java agent for registering the event type, providing some more built-in event profiles and publishing a stable release on Maven Central. Eventually, the JmFrX project might move over to the rh-jmc-team GitHub organization, which is is managed by Red Hat’s OpenJDK team and contains many other very useful projects around JDK Flight Recorder and Mission Control.
Your feedback on and contributions to JmFrX will be very welcomed!