
Java 25 was released earlier this week, and it is the first Java release with long-term support (LTS) which ships with Generational ZGC as the one (and only) flavor of the ZGC garbage collector. ZGC itself is a relatively new concurrent collector, originally added in Java 11.
The high-level intuition on concurrent garbage collectors (another example being Shenandoah) is that they move as much of their work as possible from the application’s threads to separate GC threads. That way, they essentially do away with GC pauses, which used to plague Java users in the past in the form of high tail latencies of their applications. ZGC pushes down GC times in application threads down to the sub millisecond range, making GC pauses practically a non-issue for the vast majority of use cases. Of course, there is no free lunch: by running the GC logic in separate threads, concurrent collectors require more CPU resources, thus reducing the overall throughput of the system.
So far, I haven’t had the chance to gather some hands-on experience with ZGC yet; hence, I set out to run some comparisons of ZGC and G1, which is Java’s default garbage collector since version 9. Now, ZGC oftentimes is associated with large heaps of hundreds of gigabytes and beyond, but I was curious whether it would also be beneficial for a typical microservice deployment with just a few gigabytes. Furthermore, I was eager to learn about the performance characteristics using the default settings, i.e. I’m not too interested in fine-tuning specific garbage collectors. In practice, most folks don’t bother doing so for running their applications either. Hardly anyone has the time or interest to find optimal settings, which may be obsolete very soon anyways when details of the workload change, or a new Java version with changes to the GC behavior gets released. So arguably, in most cases the performance with default settings matters more than a theoretical peak performance achievable only with highly tuned settings.
I started by benchmarking a sample microservice built using the Quarkus framework, returning some data from a Postgres database. Using Vegeta as a load generator, I created a moderate load of 1,000 requests per second. The test ran on a Hetzner CCX43 instance, using four of its 16 exclusive CPU cores and four GB of RAM. Here are the request latencies from running the test for two minutes with each collector, discarding the first 30 seconds of each run to exclude any warm-up effects. It’s not a super-scientific benchmark by any means, but good enough to show some interesting results (click to enlarge):
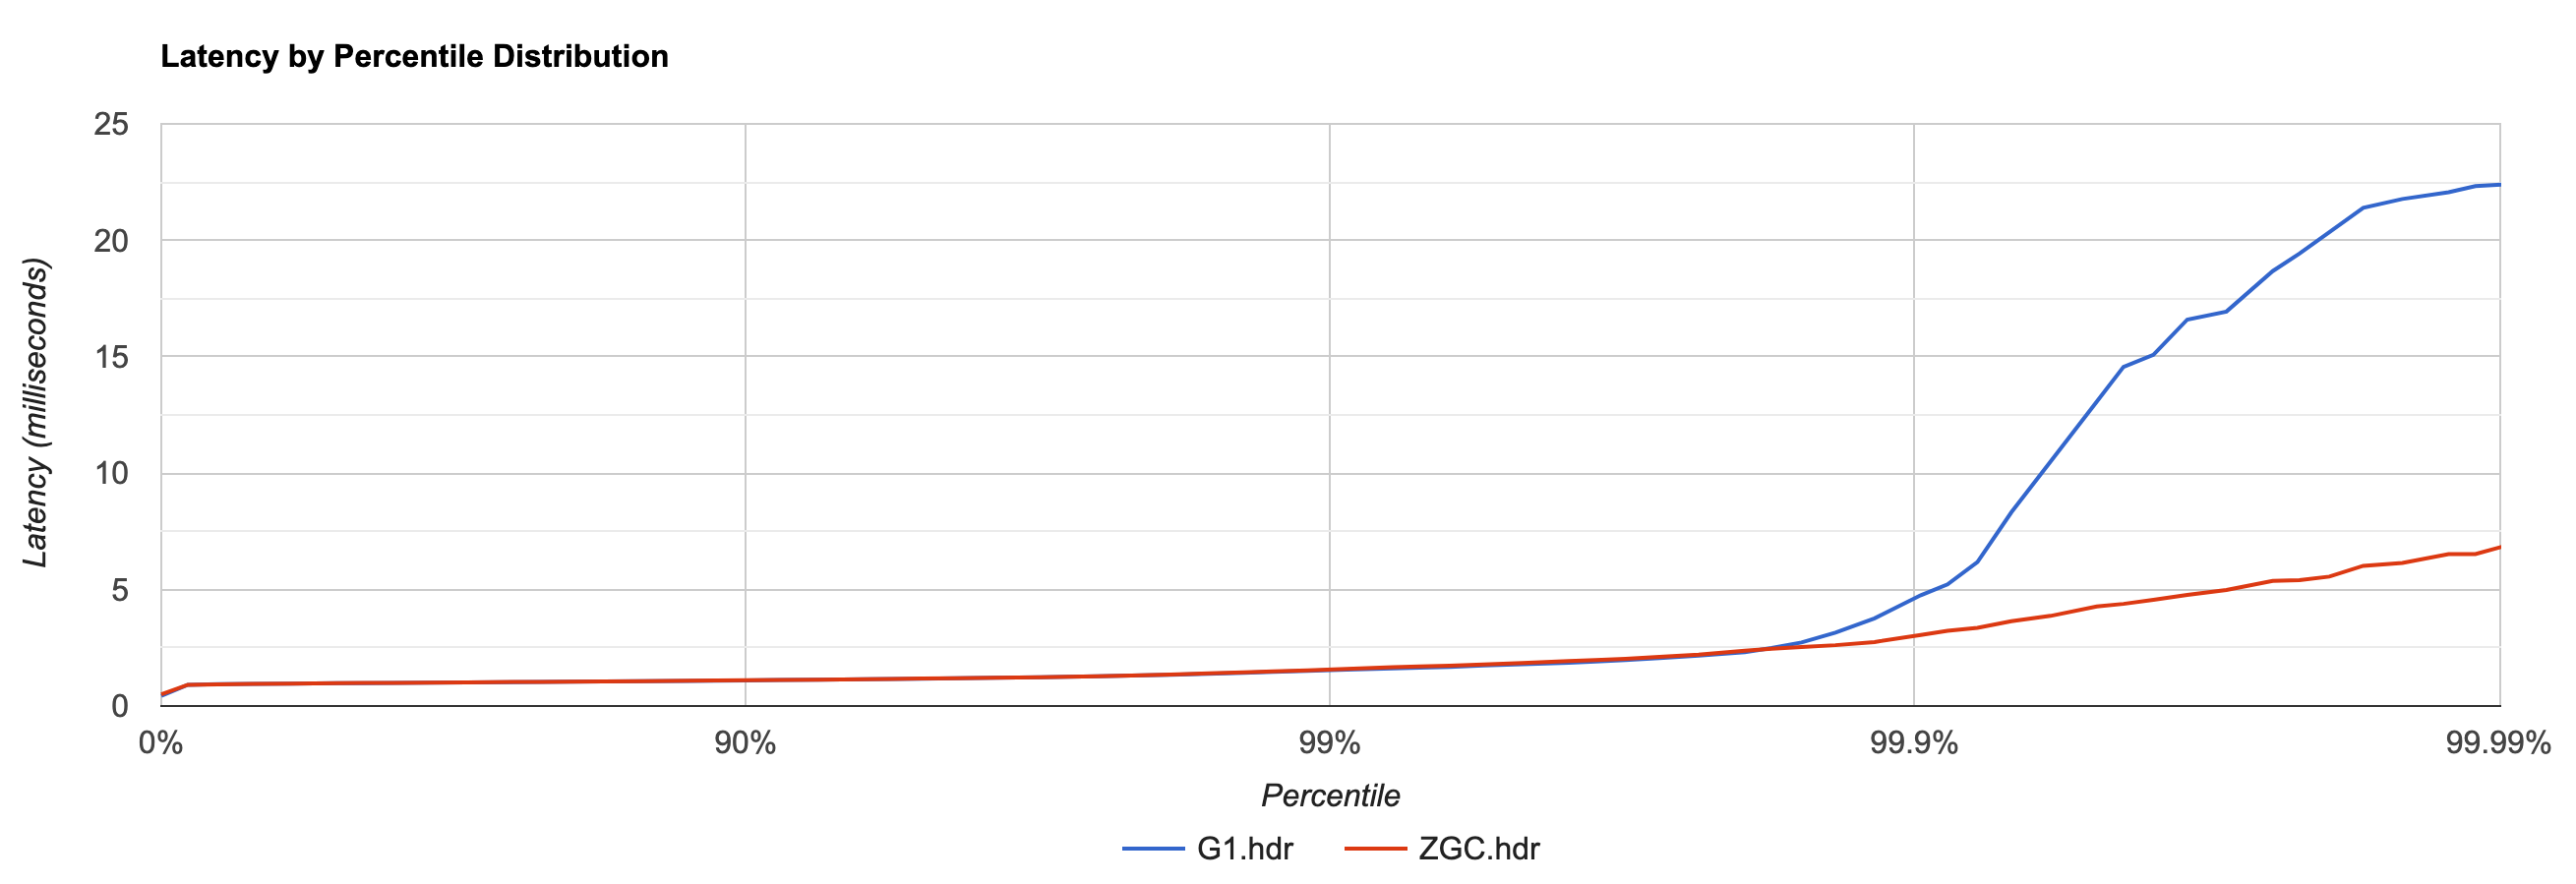
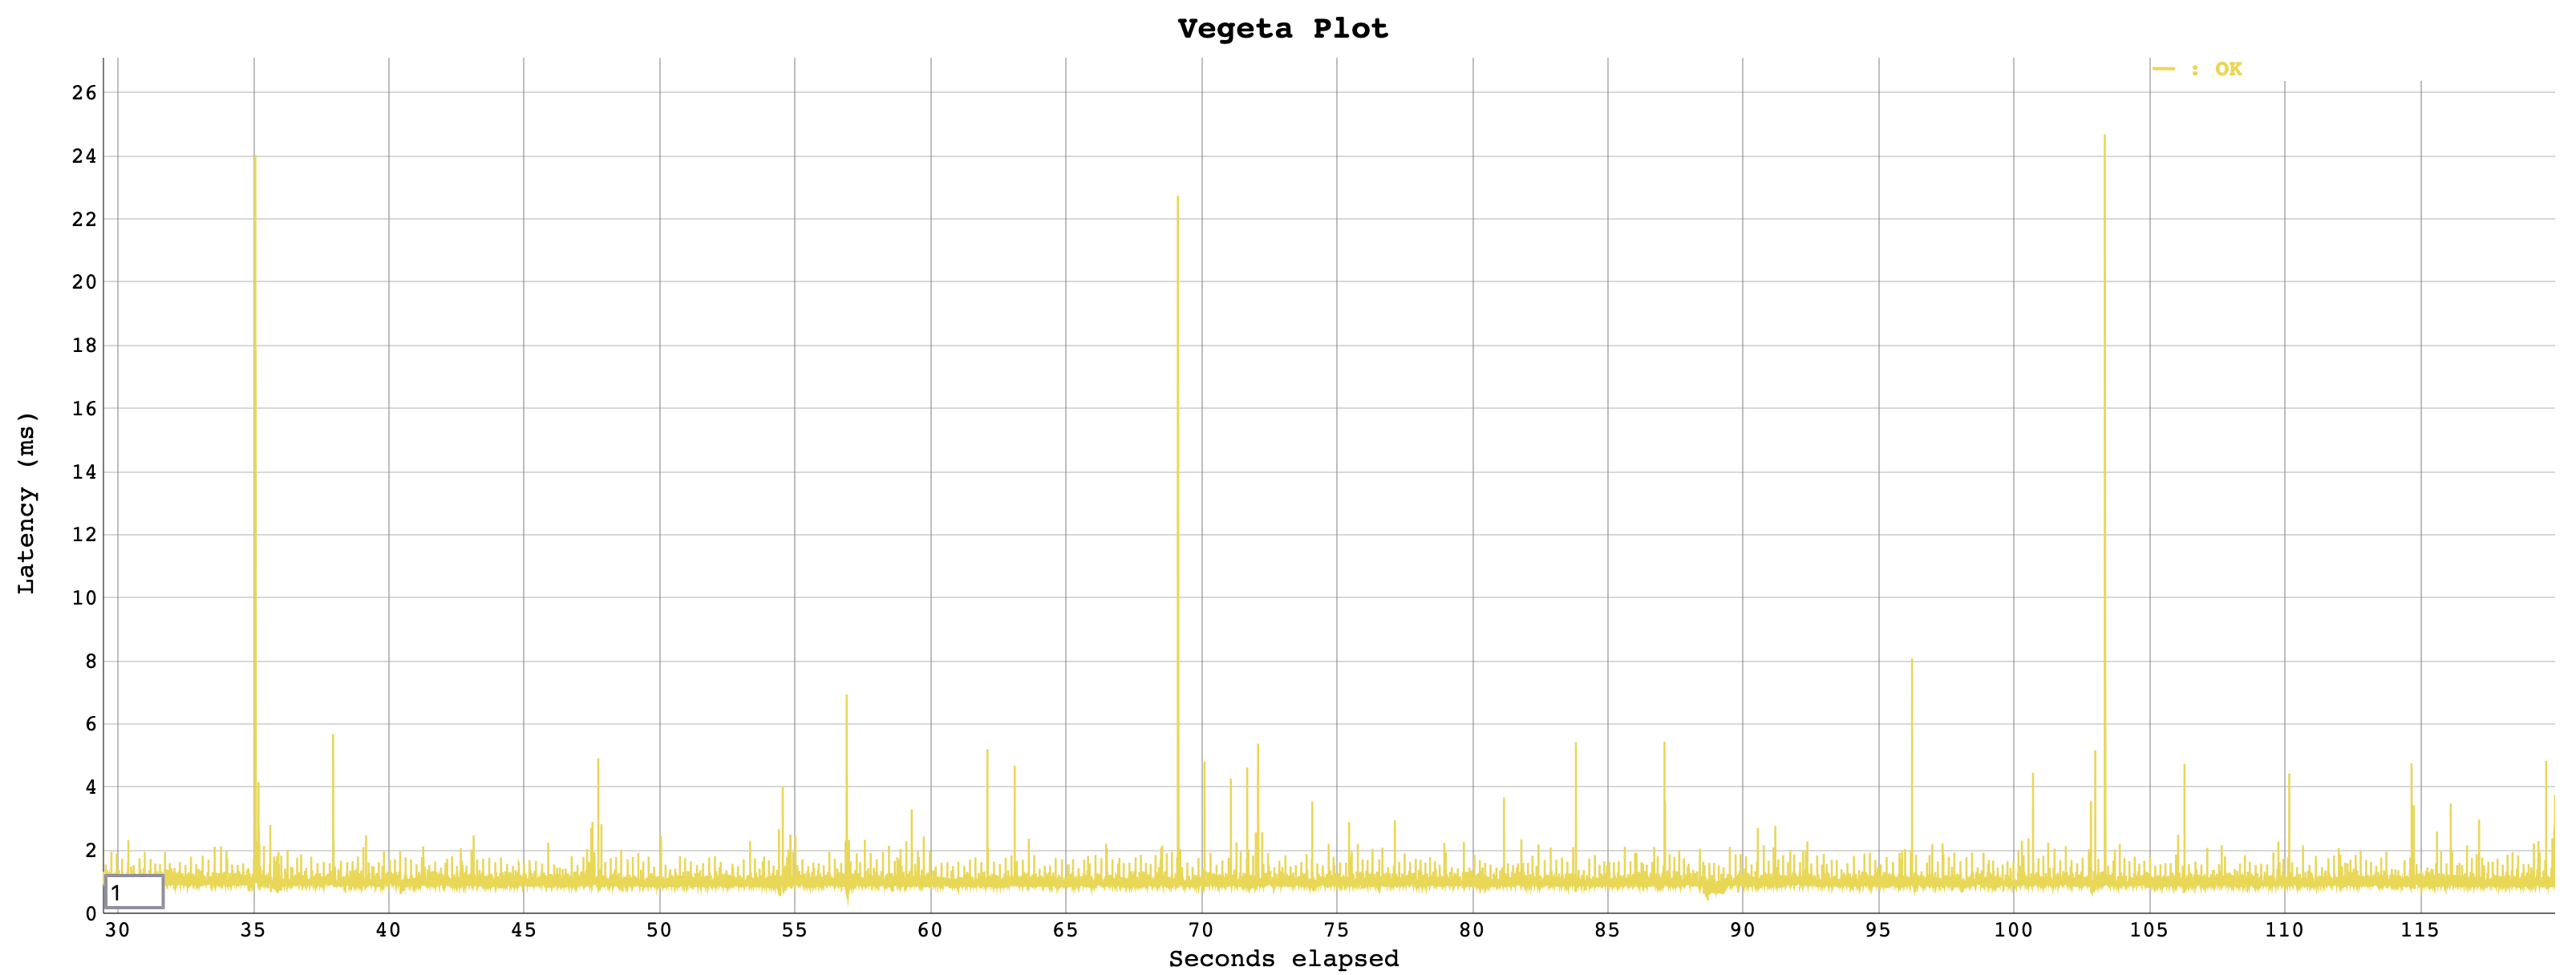
While latencies are practically identically up to the 99th percentile, the p999 and p9999 latencies show quite an advantage for ZGC. Let’s try and find out whether indeed GC pauses explain the difference. Examining the actual request latencies in the Vegeta plot show that there a several significant outliers with G1:
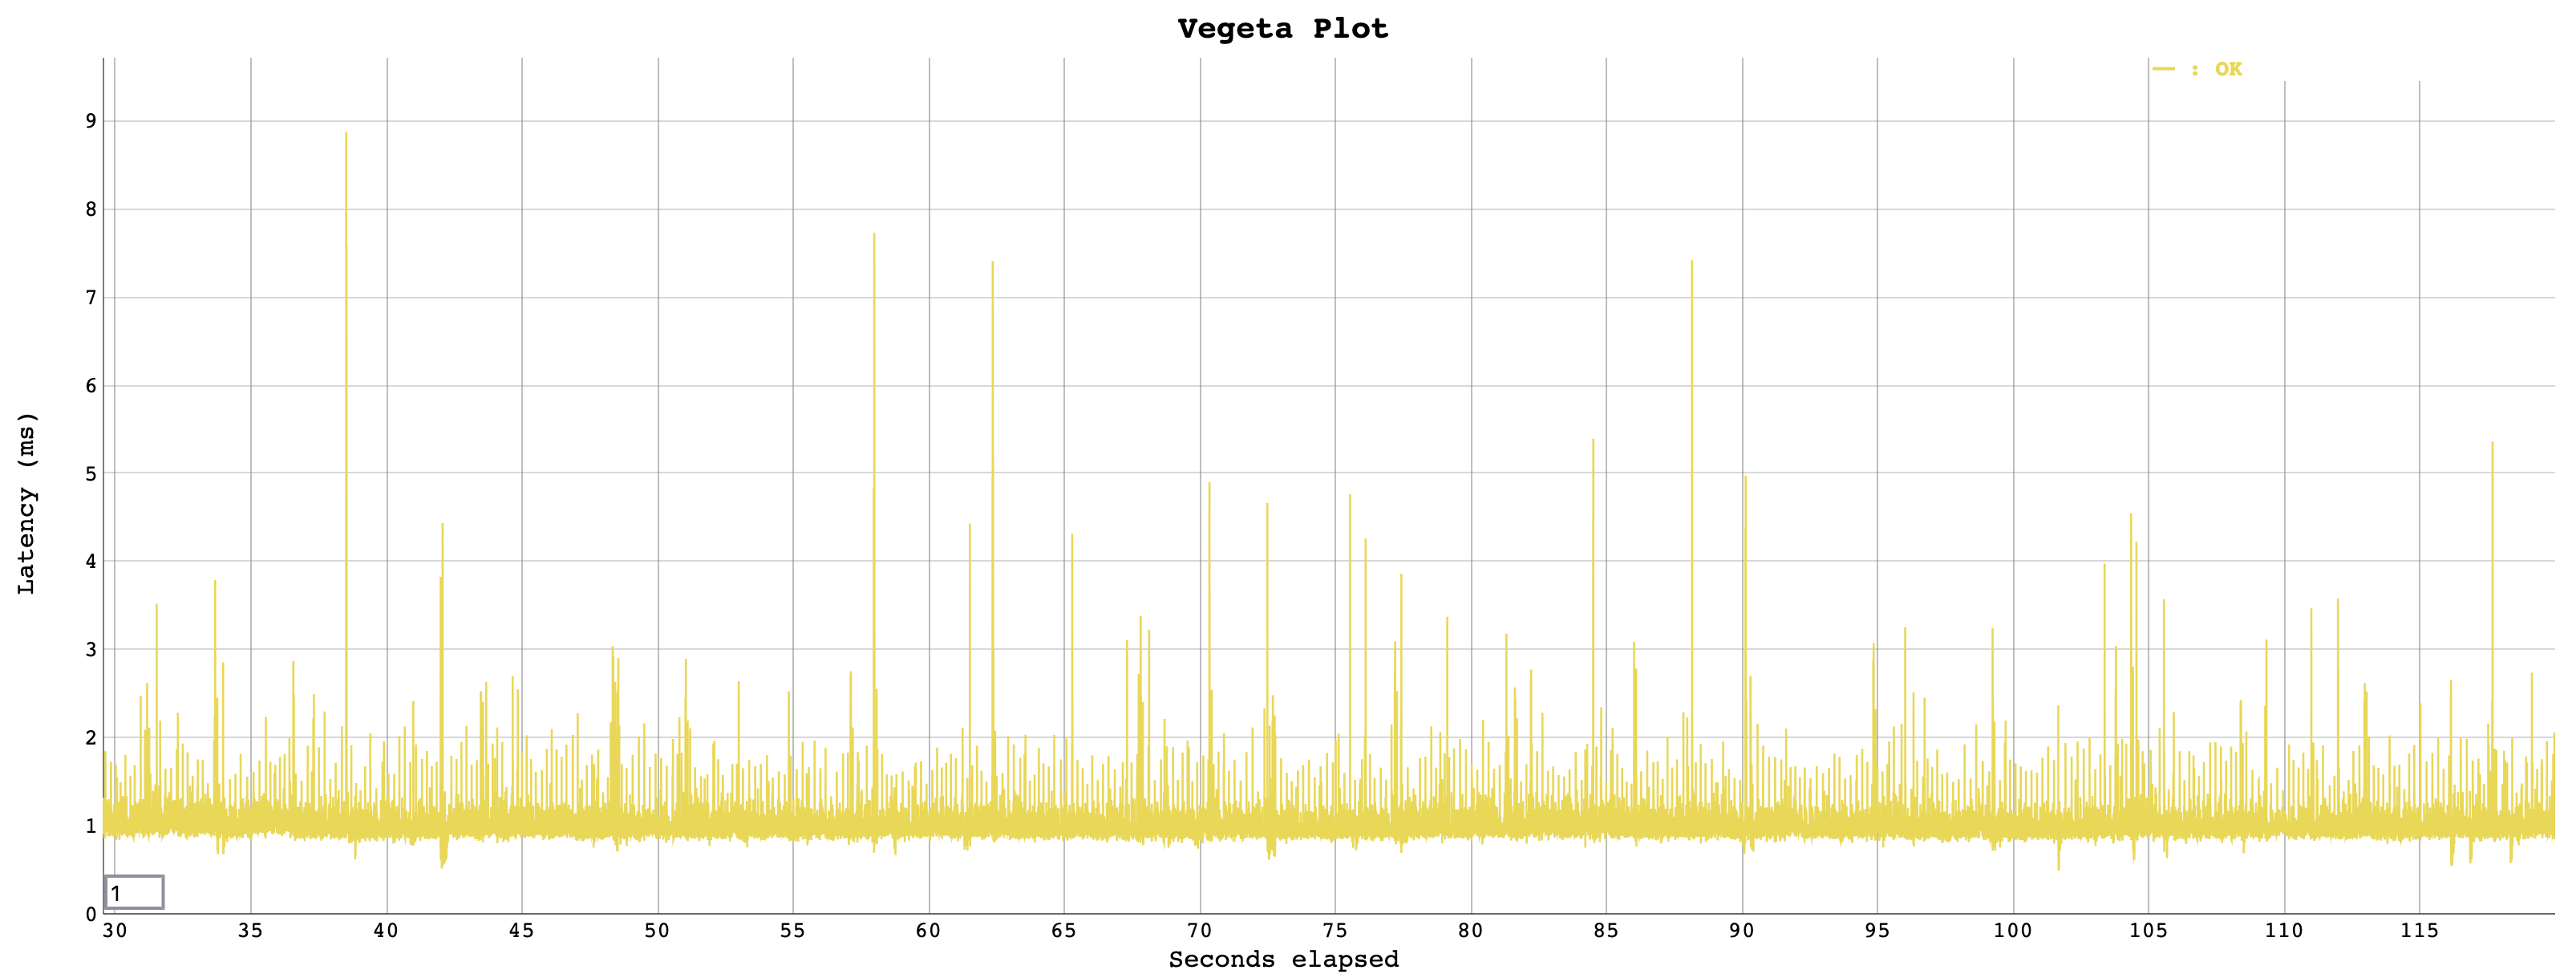
Whereas the runtimes look much more homogenous with ZGC:
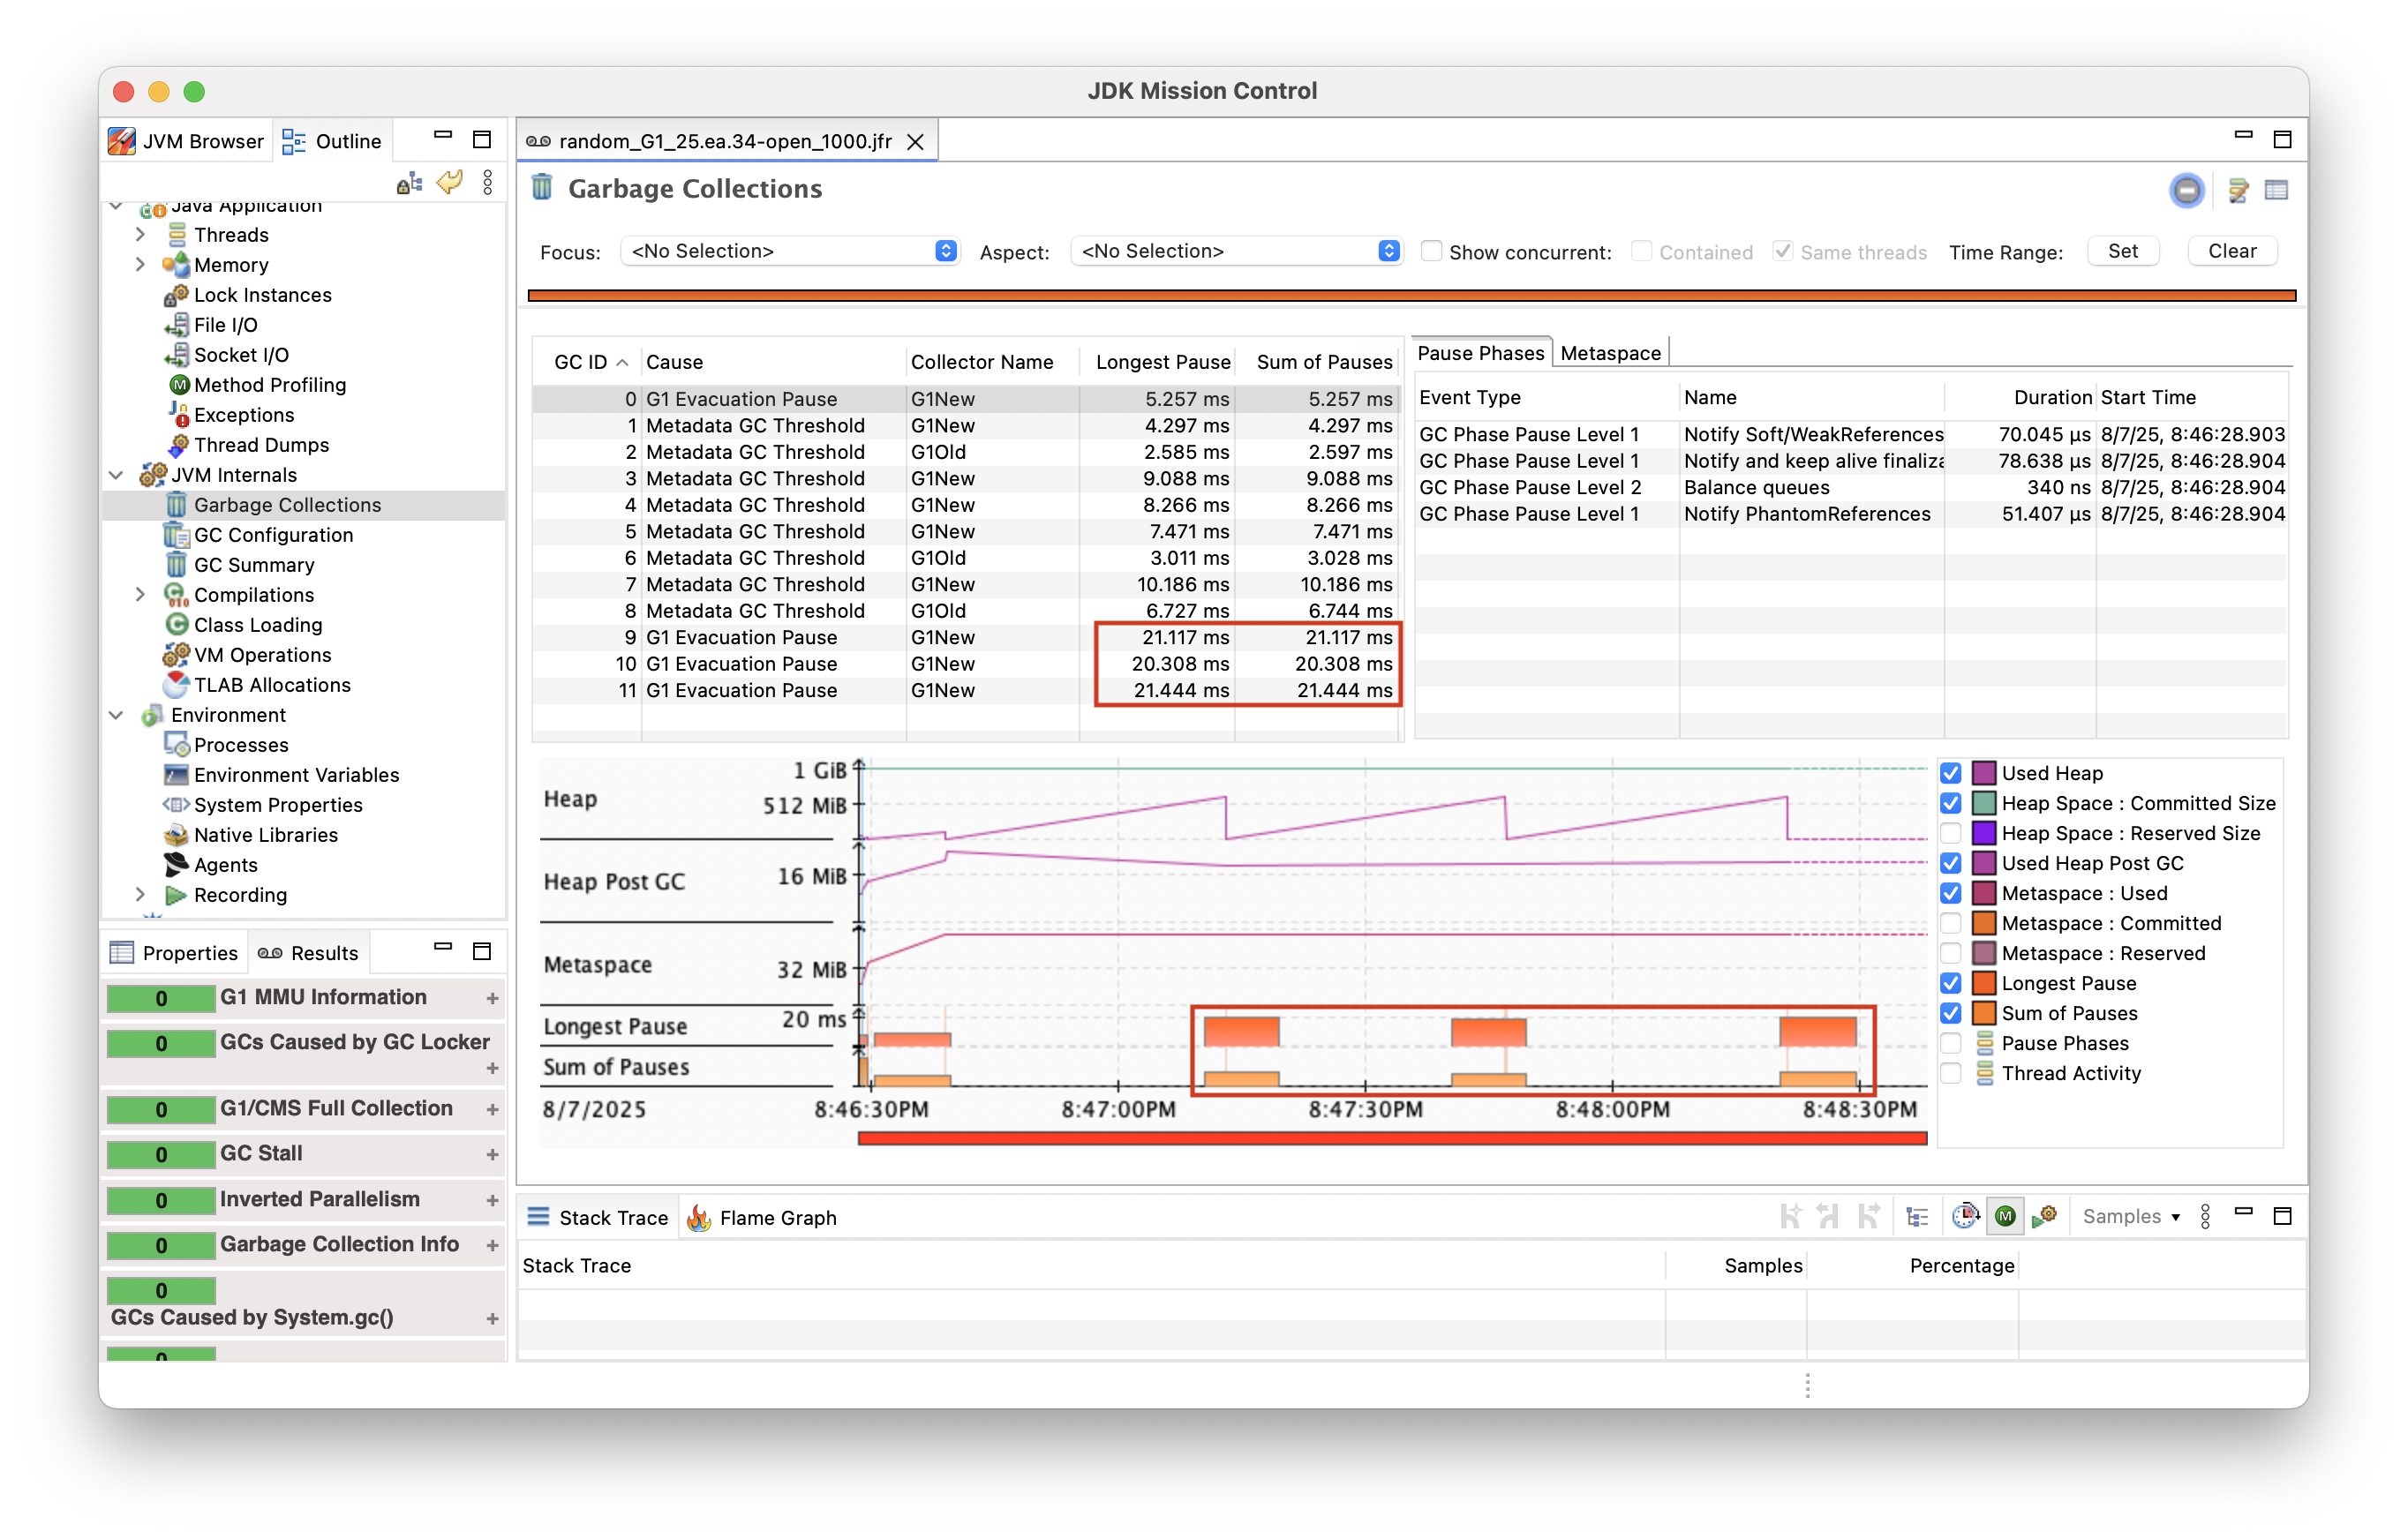
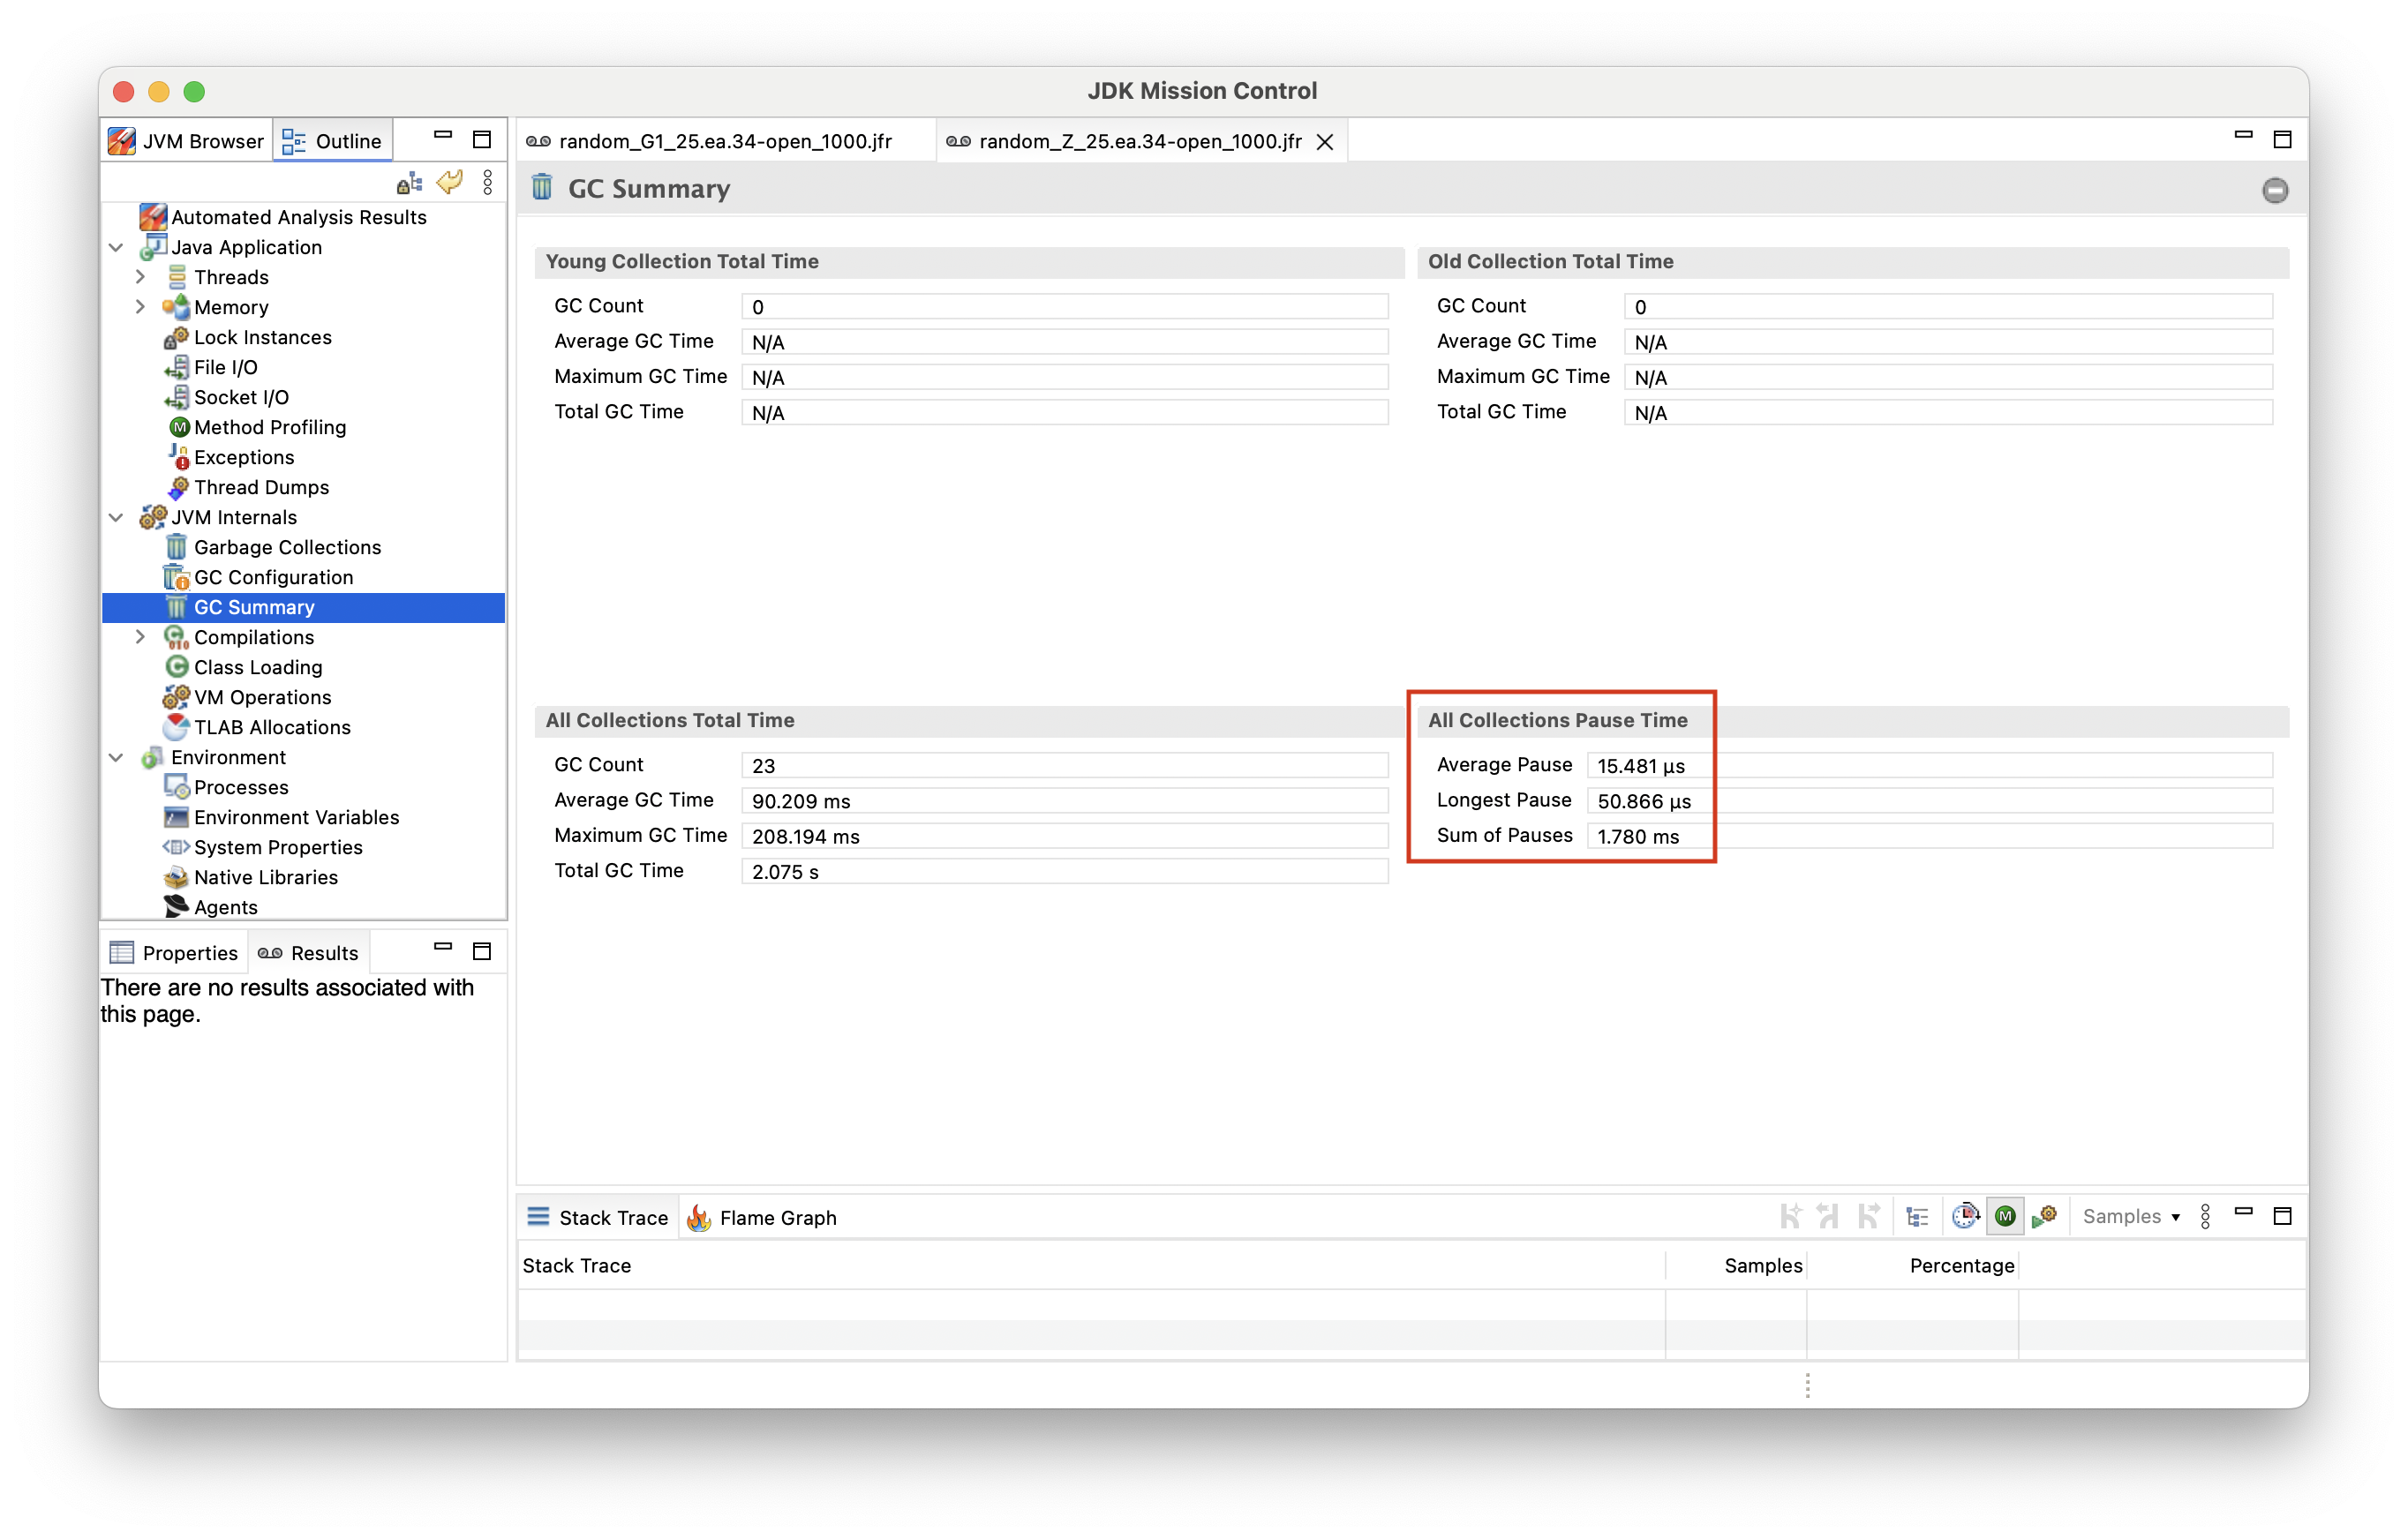
In order to verify whether the G1 outliers actually were caused by GC pauses, I enabled JDK Flight Recorder while running the tests. And indeed there we can observe GC pauses of more than 20 ms at the respective offsets in the JFR recording:
With ZGC on the other hand, the longest GC pause time observed is ~50 microseconds:
That’s pretty neat: solely by using ZGC as the garbage collector, we could improve tail latencies of this example service substantially, without any sort of tuning.
Note you may potentially get better results out of G1 too by playing with JVM options such -XX:MaxGCPauseMillis, but the much lower tail latencies you get from ZGC with default settings are what make it very appealing.
Results may look different for your specific workloads, but it’s definitely worth giving ZGC a try.
Chances are you may see some really nice benefits, without a lot of effort.
|
Garbage collections are note the only cause for JVM pauses. Other examples include the deoptimization of compiled methods and the creation of heap dumps. These, and other operations, require all threads to come to a JVM savepoint, which may take some time. This post by Zac Blanco discusses potential causes for JVM pauses and ways to analyse them. |
Now, the test above didn’t put an awful lot of pressure on the garbage collectors to begin with (~17 MB/sec), and by no means the take away should be that ZGC always is a superior choice. In particular if there is a high CPU load on the system, ZGC’s more resource-intensive approach of cleaning up garbage in concurrent threads may actually yield higher request times than G1.
ZGC Allocation Stalls
To see when and how that can be the case, let’s turn to another example.
This is a synthetic benchmark which allocates large amounts of objects in the form of List<Long> with random numbers in a loop.
The results are interesting:
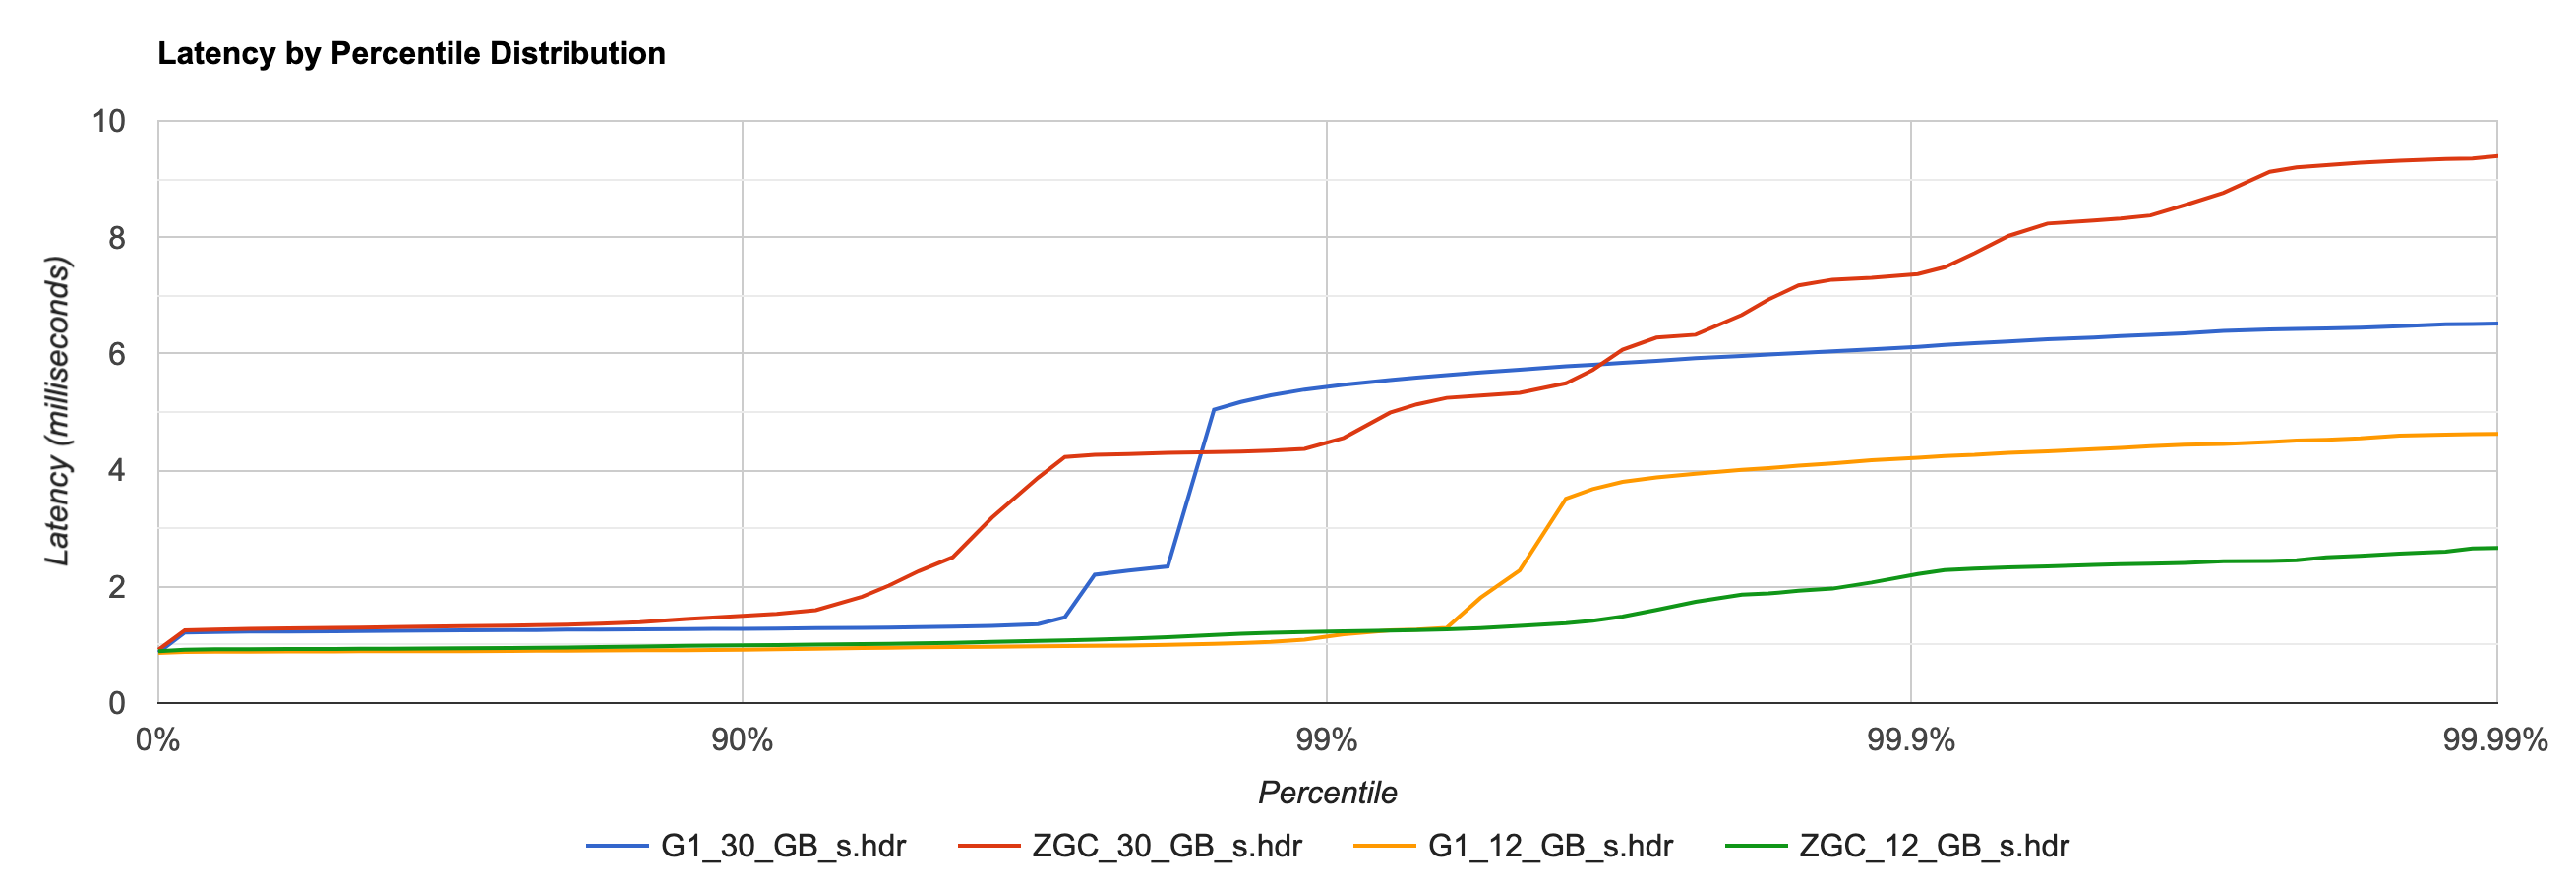
When allocating ~12 GB/sec (using 4 cores of the test system), the picture is similar to the one above: up to p99, G1 and ZGC are on par, whereas the p999 and p9999 latencies are significantly lower with ZGC. In contrast, when allocating ~30 GB/sec (using all the 16 cores of the test system), latencies are generally lower with G1 than with ZGC.
As above, a JFR recording can help to identify the cause.
Looking at GC pause times is going to be misleading though: the longest pause time of ZGC still is in the microseconds range.
So what is going on?
Running on all the system’s cores, the workload under test is CPU bound, not leaving enough CPU resources for the concurrent GC threads of ZGC.
This means that the collector can’t free up memory fast enough in order to keep up with the application allocating new objects at such a high rate.
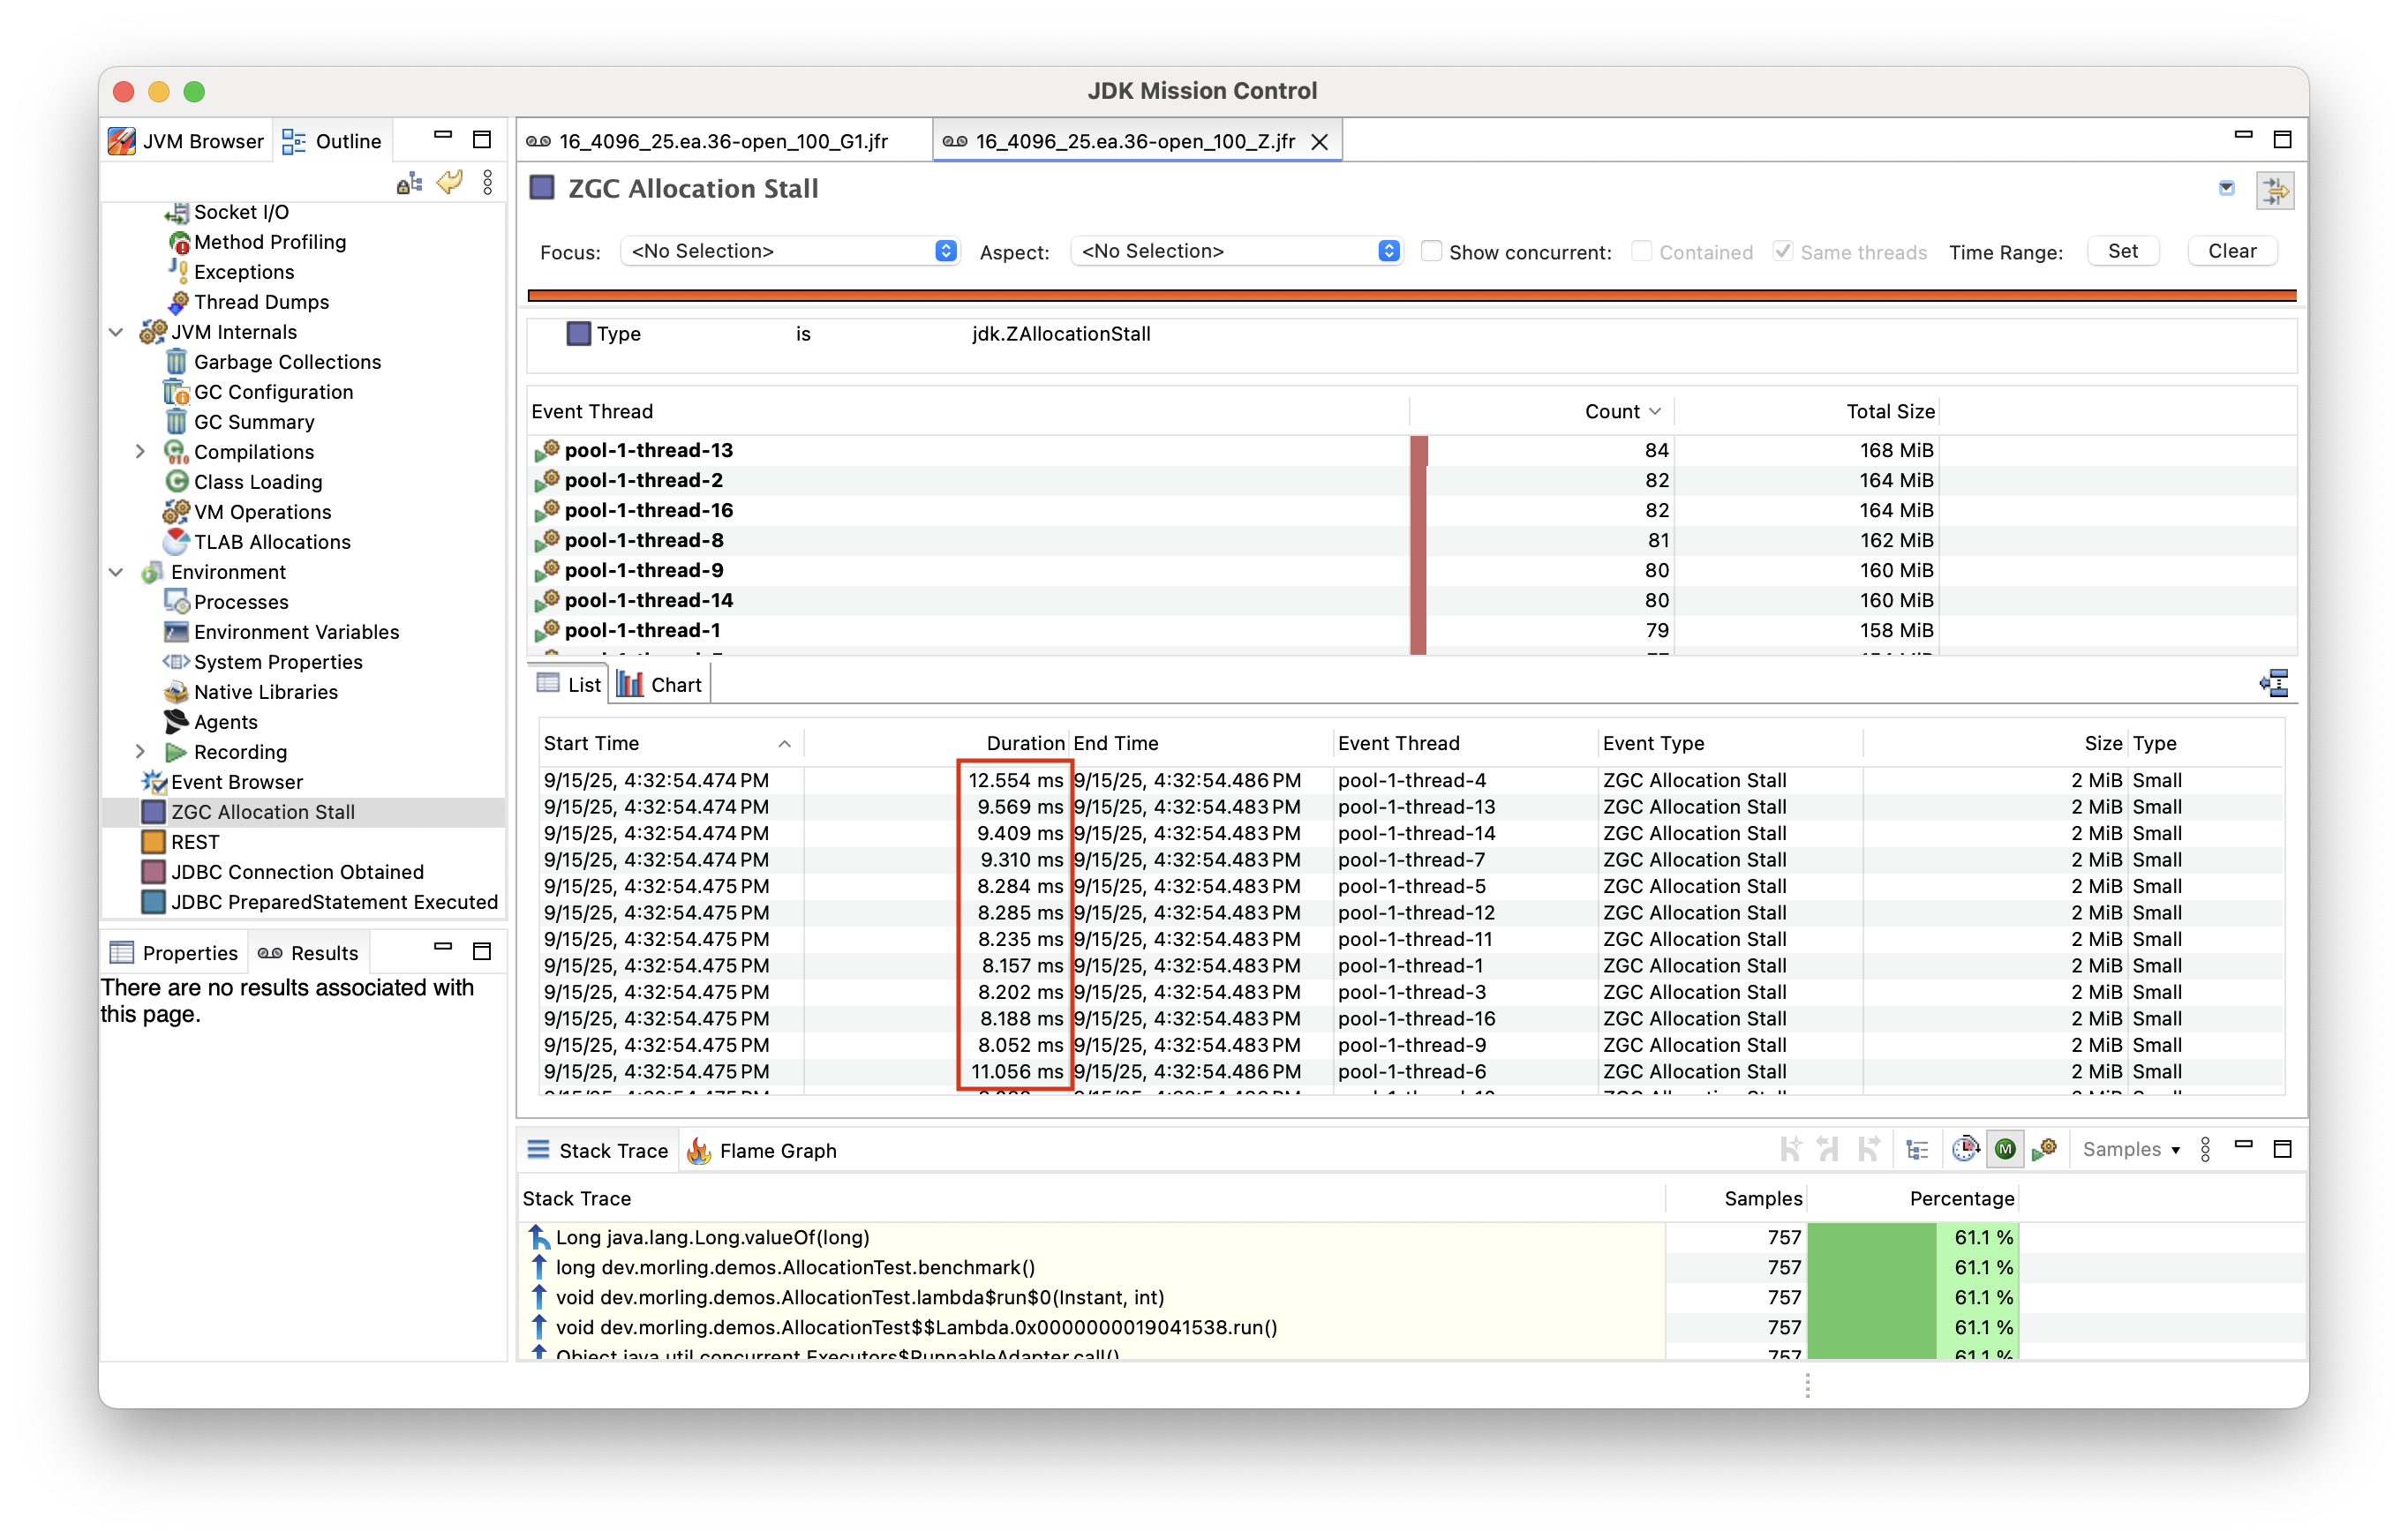
In that situation, ZGC will stall allocations until memory has become available again.
Since Java 15, a dedicated JFR event, ZAllocationStall is logged in this case:
Similar to GC pause times, allocation stalls increase tail latencies of an application. They shouldn’t be equated to GC pauses though: unlike when using a non-concurrent collector which is causing pauses in application threads, a healthy application using ZGC should generally not encounter any allocation stalls at runtime. If it does, it is a sign that the workload doesn’t have enough CPU capacity at its disposal and you should either identify potential bottlenecks using a profiler, or provision more CPU resources. It’s a good idea to monitor allocation stalls via JFR event streaming and trigger an alert when they manifest.
Summary
ZGC is a very interesting addition to the JVM’s portfolio of garbage collectors. By moving all the heavy lifting to separate GC threads, large tail latencies due to GC pauses essentially are a thing of the past, making the Java platform a compelling choice also for workloads for which it historically may not have been considered.
If you haven’t looked at ZGC before, now may be a great time to do so: Java 25 is the first release with LTS support which includes Generational ZGC as the one and only form of this collector (Java 21 also shipped generational support for ZGC, but it had to be enabled via a bespoke JVM option), yielding significant improvements in regards to throughput and tail latencies over Java 17’s single generation ZGC implementation.
|
Generational garbage collectors organize the heap in multiple generations, taking advantage "of the weak-generational hypothesis, which posits that most objects become unreachable shortly after they are created". Objects which have survived for some time after being created are moved to a heap area called the "old generation" which is scanned less frequently, thus making more efficient usage of CPU resources. |
It’s important to keep in mind though that there is not the one best garbage collector for each and every situation.
While you can get a very welcomed improvement to tail latencies by moving to ZGC, there’s a price for this to pay in the form of a lower overall throughput.
In particular if your application is close to being CPU bound already, ZGC may not be the right choice.
For many workloads though this can be mitigated by scaling out to multiple compute nodes organized in a cluster.
You should do your own testing with your specific workload in your specific runtime environment to evaluate whether moving to ZGC is beneficial or not.
Luckily that’s as simple as specifying -XX:+UseZGC when starting the JVM.
You can find the source code of the benchmarks used for this blog post here and here. If you’d like to learn more about ZGC and its concepts, the blog by OpenJDK developer Per Liden is a great starting point.
When I find the time, I’d like to run some data streaming workloads using Apache Kafka and Flink on ZGC and share my findings in a follow-up to this post. If you have any experience and insight from running these systems on ZGC, I’d love to hear from you in the comments!