
Functional unit and integration tests are a standard tool of any software development organization, helping not only to ensure correctness of newly implemented code, but also to identify regressions — bugs in existing functionality introduced by a code change. The situation looks different though when it comes to regressions related to non-functional requirements, in particular performance-related ones: How to detect increased response times in a web application? How to identify decreased throughput?
These aspects are typically hard to test in an automated and reliable way in the development workflow, as they are dependent on the underlying hardware and the workload of an application. For instance assertions on the duration of specific requests of a web application typically cannot be run in a meaningful way on a developer laptop, which differs from the actual production hardware (ironically, nowadays both is an option, the developer laptop being less or more powerful than the actual production environment). When run in a virtualized or containerized CI environment, such tests are prone to severe measurement distortions due to concurrent load of other applications and jobs.
This post introduces the JfrUnit open-source project, which offers a fresh angle to this topic by supporting assertions not on metrics like latency/throughput themselves, but on indirect metrics which may impact those. JfrUnit allows you define expected values for metrics such as memory allocation, database I/O, or number of executed SQL statements, for a given workload and asserts the actual metrics values — which are obtained from JDK Flight Recorder events — against these expected values. Starting off from a defined base line, future failures of such assertions are an indicator for potential performance regressions in an application, as a code change may have introduced higher GC pressure, the retrieval of unneccessary data from the database, or SQL problems commonly induced by ORM tools, like N+1 SELECT statements.
JfrUnit provides means of identifying and analyzing such anomalies in a reliable, environment independent way in standard JUnit tests, before they manifest as actual performance regressions in production. Test results are independent from wall clock time and thus provide actionable information, also when not testing with production-like hardware and data volumes.
This post is a bit longer than usual (I didn’t have the time to write shorter ;), but it’s broken down into several sections, so you can pause and continue later on with fresh energy:
Getting Started With JfrUnit
JfrUnit is an extension for JUnit 5 which integrates Flight Recorder into unit tests; it makes it straight forward to initiate a JFR recording for a given set of event types, execute some test routine, and then assert the JFR events which should have been produced.
Here is a basic example of a JfrUnit test:
 1
 2
 3
 4
 5
 6
 7
 8
 9
10
11
12
13
14
15
16
17
18
19
20
21
22
23
24
25
26
27
28
@JfrEventTest (1)
public class JfrUnitTest {

  public JfrEvents jfrEvents = new JfrEvents();

  @Test
  @EnableEvent("jdk.GarbageCollection") (2)
  @EnableEvent("jdk.ThreadSleep")
  public void shouldHaveGcAndSleepEvents() throws Exception {
    System.gc();
    Thread.sleep(1000);

    jfrEvents.awaitEvents(); (3)

    ExpectedEvent event = event("jdk.GarbageCollection"); (4)
    assertThat(jfrEvents).contains(event);

    event = event("jdk.GarbageCollection") (4)
        .with("cause", "System.gc()"));
    assertThat(jfrEvents).contains(event);

    event = event("jdk.ThreadSleep").
        with("time", Duration.ofSeconds(1)));
    assertThat(jfrEvents).contains(event);

    assertThat(jfrEvents.ofType("jdk.GarbageCollection")).hasSize(1); (5)
  }
}
| 1 | @JfrEventTest marks this as a JfrUnit test, activating its extension |
| 2 | All JFR event types to be recorded must be enabled via @EnableEvent |
| 3 | After running the test logic, awaitEvents() must be invoked as a synchronization barrier,
making sure all previously produced events have been received |
| 4 | Using the JfrEventsAssert#event() method, an ExpectedEvent instance can be created — optionally specifying one or more expected attribute values — which then is asserted via JfrEventsAssert#assertThat() |
| 5 | JfrEvents#ofType() allows to filter on specific event types, enabling arbitrary assertions against the returned stream of RecordedEvents |
By means of a custom assertThat() matcher method for AssertJ,
JfrUnit allows to validate that specific JFR events are raised during at test.
Events to be matched are described via their event type name, and optionally one more event attribute vaues.
As we’ll see in a bit, JfrUnit also integrates nicely with the Java Stream API,
allowing you to filter and aggregate recorded event atribute values and match them against expected values.
JfrUnit persists a JFR recording file for each test method, which you can examine after a test failure, for instance using JDK Mission Control. To learn more about JfrUnit and its capabilities, take a look at the project’s README. The project is in an early proof-of-concept stage at the moment, so changes to its APIs and semantics are likely.
Now that you’ve taken the JfrUnit quick tour, let’s put that knowledge into practice. Our example project will be the Todo Manager Quarkus application you may already be familiar with from my earlier post about custom JFR events. We’re going to discuss two examples for using JfrUnit to identify potential performance regressions.
Case Study 1: Spotting Increased Memory Allocation
At first, let’s explore how to identify increased memory allocation rates. Typically, it’s mostly library and middleware authors who are interested in this. For a library such as Hibernate ORM it can make a huge difference whether a method that is invoked many times on a hot code path allocates a few objects more or less. Less object allocations mean less work for the garbage collector, which in turn means those precious CPU cores of your machine can spend more cycles processing your actual business logic.
But also for application developers it can be beneficial to keep an eye on — and systematically track — object allocations, as regressions there lead to increased GC pressure, and in turn eventually to higher latencies and reduced throughput.
The key for tracking object allocations with JFR are the jdk.ObjectAllocationInNewTLAB and jdk.ObjectAllocationOutsideTLAB events,
which are emitted when
-
an object allocation triggered the creation of a new thread-local allocation buffer (TLAB)
-
an object got allocated outside of the thread’s TLAB
|
Thread-local allocation buffers (TLAB)
When creating new object instances on the heap, this primarily happens via thread-local allocation buffers. A TLAB is a pre-allocated memory block that’s exclusively used by a single thread. Since this space is exclusively owned by the thread, creating new objects within a TLAB can happen without costly synchronization with other threads. Once a thread’s current TLAB capacity is about to be exceeded by a new object allocation, a new TLAB will be allocated for that thread. In addition, large objects will typically need to be directly allocated outside of the more efficient TLAB space. To learn more about TLAB allocation, refer to part #4 of Aleksey Shipilёv’s "JVM Anatomy Quark" blog series. |
Note these events don’t allow for tracking of each individual object allocation,
as multiple objects will be allocated within a TLAB before a new one is required, and thus the jdk.ObjectAllocationInNewTLAB event will be emitted.
But as that event exposes the size of the new TLAB, we can keep track of the overall amount of memory that’s allocated while the application is running.
In that sense, jdk.ObjectAllocationInNewTLAB represents a sampling of object allocations,
which means we need to collect a reasonable number of events to identify those locations in the program which are the sources of high object allocation and thus frequently trigger new TLAB creations.
So let’s start and work on a test for spotting regressions in terms of object allocations of one of the Todo Manager app’s API methods, GET /todo/{id}.
To identify a baseline of the allocation to be expected,
we first invoke that method in a loop and print out the actual allocation values.
This should happen in intervals, e.g. every 10,000 invocations,
so to average out numbers from individual API calls.
 1
 2
 3
 4
 5
 6
 7
 8
 9
10
11
12
13
14
15
16
17
18
19
20
21
22
23
24
25
26
27
28
29
30
31
32
33
34
35
36
37
38
39
40
41
42
43
44
45
46
47
48
49
50
51
52
53
54
55
56
57
58
59
60
61
62
63
@Test
@EnableEvent("jdk.ObjectAllocationInNewTLAB") (1)
@EnableEvent("jdk.ObjectAllocationOutsideTLAB")
public void retrieveTodoBaseline() throws Exception {
  Random r = new Random();

  HttpClient client = HttpClient.newBuilder()
      .build();

  for (int i = 1; i<= 100_000; i++) {
    executeRequest(r, client);

    if (i % 10_000 == 0) {
      jfrEvents.awaitEvents(); (2)

      long sum = jfrEvents.filter(this::isObjectAllocationEvent)  (3)
          .filter(this::isRelevantThread)
          .mapToLong(this::getAllocationSize)
          .sum();

      System.out.printf(
          Locale.ENGLISH,
          "Requests executed: %s, memory allocated: (%,d bytes/request)%n",
          i, sum/10_000
      );

      jfrEvents.reset(); (4)
    }
  }

  private void executeRequest(Random r, HttpClient client) throws Exception {
    int id = r.nextInt(20) + 1;

    HttpRequest request = HttpRequest.newBuilder()
        .uri(new URI("http://localhost:8081/todo/" + id))
        .headers("Content-Type", "application/json")
        .GET()
        .build();

    HttpResponse<String> response = client
        .send(request, HttpResponse.BodyHandlers.ofString());

    assertThat(response.statusCode()).isEqualTo(200);
  }

  private boolean isObjectAllocationEvent(RecordedEvent re) { (5)
    String name = re.getEventType().getName();
    return name.equals("jdk.ObjectAllocationInNewTLAB") ||
        name.equals("jdk.ObjectAllocationOutsideTLAB");
  }

  private long getAllocationSize(RecordedEvent re) { (6)
    return re.getEventType().getName()
        .equals("jdk.ObjectAllocationInNewTLAB") ?
            re.getLong("tlabSize") :
            re.getLong("allocationSize");
  }

  private boolean isRelevantThread(RecordedEvent re) { (7)
    return re.getThread().getJavaName().startsWith("vert.x-eventloop") ||
        re.getThread().getJavaName().startsWith("executor-thread");
  }
}
| 1 | Enable the jdk.ObjectAllocationInNewTLAB and jdk.ObjectAllocationOutsideTLAB JFR events |
| 2 | Every 10,000 events, wait for all the JFR events produced so far |
| 3 | Calculate the total allocation size, by summing up the TLAB allocations of all relevant threads |
| 4 | Reset the event stream for the next iteration |
| 5 | Is this a TLAB event? |
| 6 | Get the new TLAB size in case of an in TLAB allocation, otherwise the allocated object size out of TLAB |
| 7 | We’re only interested in the web application’s own threads, in particular ignoring the main thread which runs the HTTP client of the test |
Note that unlike in the initial example showing the usage of JfrUnit,
here we’re not using the simple contains() AssertJ matcher,
but rather calculate some custom value — the overall object allocation in bytes — by means of filtering and aggregating the relevant JFR events.
Here are the numbers I got from running 100,000 invocations:
 1
 2
 3
 4
 5
 6
 7
 8
 9
10
Requests executed: 10000, memory allocated: 34096 bytes/request
Requests executed: 20000, memory allocated: 31768 bytes/request
Requests executed: 30000, memory allocated: 31473 bytes/request
Requests executed: 40000, memory allocated: 31462 bytes/request
Requests executed: 50000, memory allocated: 31547 bytes/request
Requests executed: 60000, memory allocated: 31545 bytes/request
Requests executed: 70000, memory allocated: 31537 bytes/request
Requests executed: 80000, memory allocated: 31624 bytes/request
Requests executed: 90000, memory allocated: 31703 bytes/request
Requests executed: 100000, memory allocated: 31682 bytes/request
As we see, there’s some warm-up phase during which allocation rates still go down, but after ~20 K requests, the allocation per request is fairly stable, with a volatility of ~1% when averaged out over 10K requests. This means that this initial phase should be excluded during the actual test.
To emphasize the key part again, this allocation is per request, it is independent from wall clock time and thus is neither dependent from the machine running the test (i.e. the test should behave the same when running on a developer laptop and on a CI machine), nor is it subject to volatility induced by other workloads running concurrently.
|
Tracking Object Allocations in Java 16
The two TLAB allocation events provide all the information required for analysing object allocations in Java applications, but often it’s not practical to enable them on a continuous basis when running in production. Due to the high amount of events produced, enabling them adds some overhead in terms of latency, also the size of JFR recording files can be hard to predict. Both issues are addressed by a JFR improvement that’s proposed for inclusion into Java 16,
"JFR Event Throttling".
This will provide control over the emission rate of events, e.g. allowing to sample object allocations with a defined rate of 100 events per second,
which addresses both the overhead as well as the recording size issue.
A new event type, For JfrUnit, explicit control over the event sampling rate will be a very interesting capability, as a higher sampling rate may lead to stable results more quickly, in turn resulting in shorter test execution times. |
Based on that, the actual test could look like so:
 1
 2
 3
 4
 5
 6
 7
 8
 9
10
11
12
13
14
15
16
17
18
19
20
21
22
23
24
25
26
27
@Test
@EnableEvent("jdk.ObjectAllocationInNewTLAB")
@EnableEvent("jdk.ObjectAllocationOutsideTLAB")
public void retrieveTodo() throws Exception {
  Random r = new Random();
  HttpClient client = HttpClient.newBuilder().build();

  for (int i = 1; i<= 20_000; i++) { (1)
    executeRequest(r, client);
  }

  jfrEvents.awaitEvents();
  jfrEvents.reset();

  for (int i = 1; i<= 10_000; i++) { (2)
    executeRequest(r, client);
  }

  jfrEvents.awaitEvents();

  long sum = jfrEvents.filter(this::isObjectAllocationEvent)
      .filter(this::isRelevantThread)
      .mapToLong(this::getAllocationSize)
      .sum();

  assertThat(sum / 10_000).isLessThan(33_000); (3)
}
| 1 | Warm-up phase |
| 2 | The actual test phase |
| 3 | Assert the memory allocation per request is within the expected boundary; note we could also add a lower boundary, so to make sure we notice any future improvements (e.g. caused by upgrading to new efficient versions of a library), which otherwise may hide subsequent regressions |
Now let’s assume we’ve wrapped up the initial round of work on this application, and its tests have been passing on CI for a while.
One day, the retrieveTodo() performance test method fails though:
1
2
3
4
5
java.lang.AssertionError:
Expecting:
 <388370L>
to be less than:
 <33000L>
Ugh, it’s suddenly allocating about ten times more memory per request than before! What has happened? To find the answer, we can take a look at the test’s JFR recording, which JfrUnit persists under target/jfrunit:
1
2
3
4
ls target/jfrunit

dev.morling.demos.quarkus.TodoResourcePerformanceTest-createTodo.jfr
dev.morling.demos.quarkus.TodoResourcePerformanceTest-retrieveTodo.jfr
Let’s open the *.jfr file for the failing test in JDK Mission Control (JMC) in order to analyse all the recorded events (note that the recording will always contain some JfrUnit-internal events which are needed for synchronizing the recording stream and the events exposed to the test).
When taking a look at the TLAB events of the application’s executor thread, the culprit is identified quickly; a lot of the sampled TLAB allocations contain this stack trace (click on the image to enlarge):
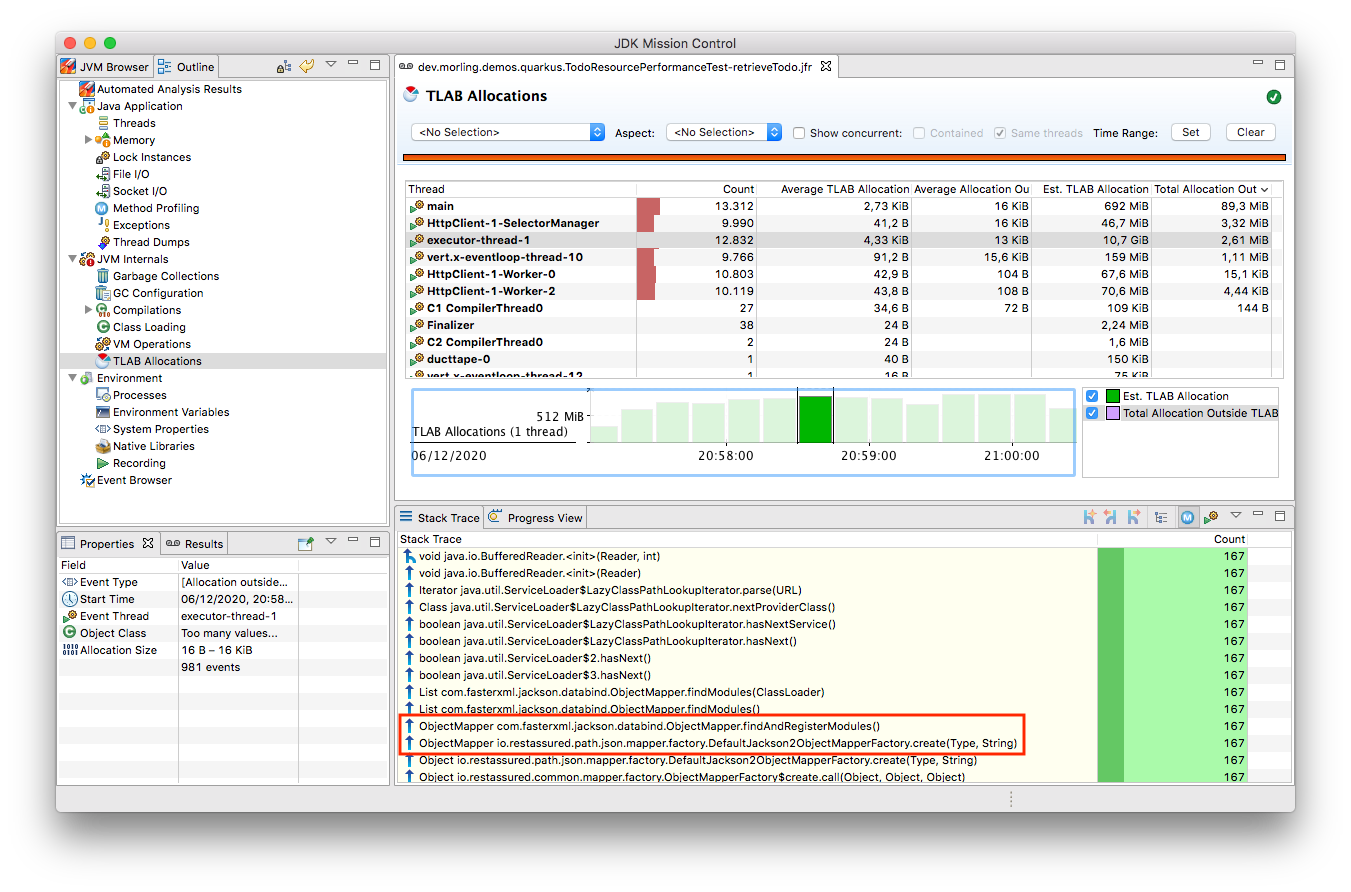
Interesting, REST Assured loading a Jackson object mapper, what’s going on there? Here’s the full stacktrace:
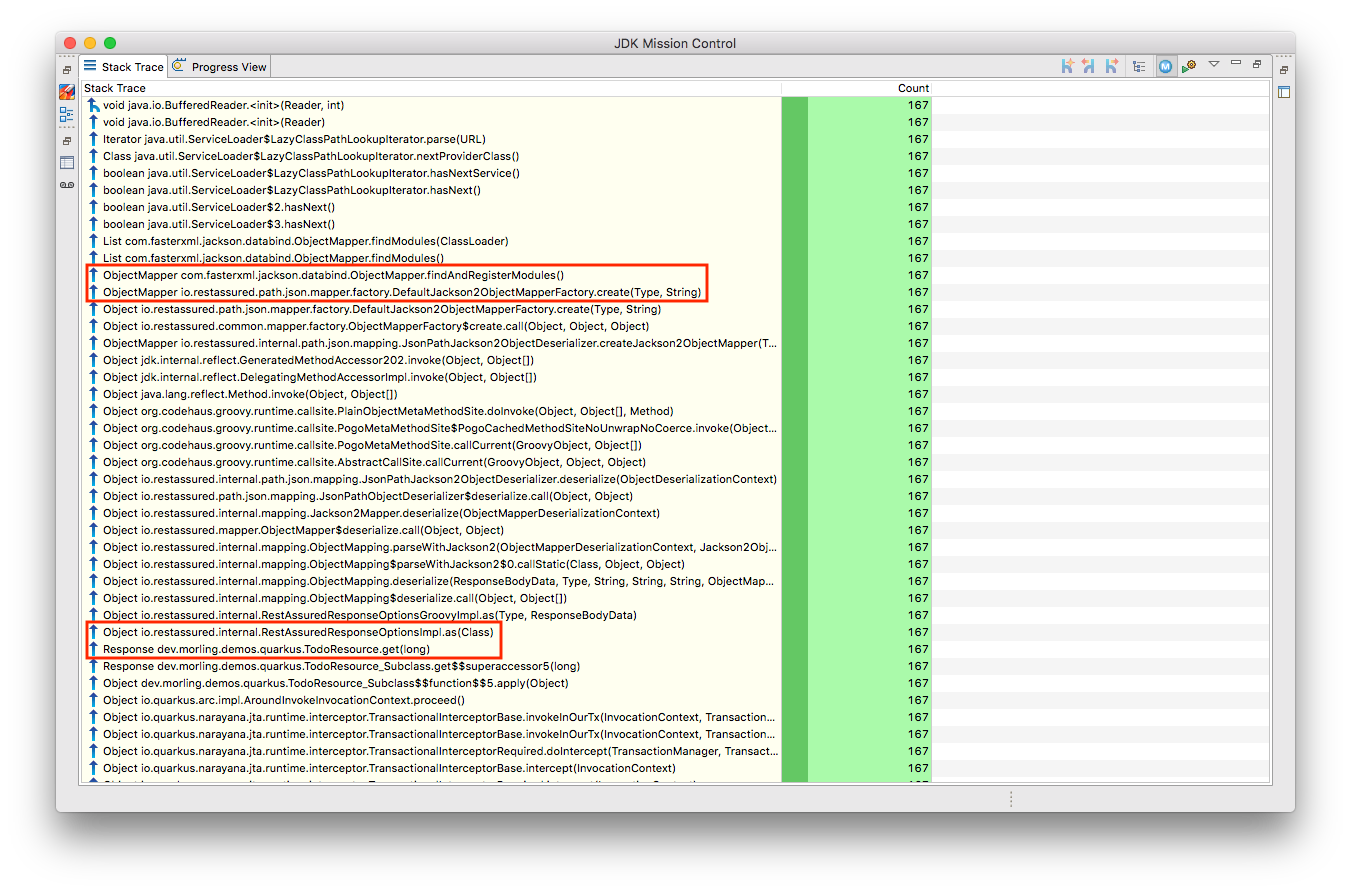
So it seems a REST call to another service is made from within the TodoResource#get(long) method!
At this point we know where to look into the source code of the application:
 1
 2
 3
 4
 5
 6
 7
 8
 9
10
11
12
13
14
15
16
17
18
@GET
@Transactional
@Produces(MediaType.APPLICATION_JSON)
@Path("/{id}")
public Response get(@PathParam("id") long id) throws Exception {
  Todo res = Todo.findById(id);

  User user = RestAssured.given().port(8082)
      .when()
          .get("/users/" + res.userId)
          .as(User.class);

  res.userName = user.name;

  return Response.ok()
      .entity(res)
      .build();
}
Gasp, it looks like a developer on the team has been taking the microservices mantra a bit too far, and has changed the code so it invokes another service in order to obtain some additional data associated to the user who created the retrieved todo.
While that’s problematic in its own right due to the inherent coupling between the two services (how should the Todo Manager service react if the user service isn’t available?), they made matters worse by using the REST Assured API as a REST client, in a less than ideal way. The API’s simplicity and elegance makes it a great solution for testing (and indeed that’s its primary use case), but this particular usage seems to be not such a good choice for production code.
At this point you should ask yourself whether the increased allocation per request actually is a problem for your application or not. To determine if that’s the case, you could run some tests on actual request latency and throughput in a production-like environment. If there’s no impact based on the workload you have to process, you might very well decide that additional allocations are well spent for your application’s purposes.
Increasing the allocation per request by a factor of ten in the described way quite likely does not fall into this category, though. At the very least, we should look into making the call against the User REST API more efficiently, either by setting up REST Assured in a more suitable way, or by looking for an alternative REST client. Of course the external API call just by itself adds to the request latency, which is something we might want to avoid.
It’s also worth examining the application’s garbage collection behavior. In order to so, you can run the performance test method again, either enabling all the GC-related JFR event types, or by enabling a pre-existing JFR configuration (the JDK comes with two built-in JFR configurations, default and profile, but you can also create and export them via JMC):
1
2
3
4
5
@Test
@EnableConfiguration("profile")
public void retrieveTodo() throws Exception {
  // ...
}
Note that the pre-defined configurations imply minimum durations for certain event types; e.g. the I/O events discussed in the next section will only be recorded if they have a duration of 20 ms or longer. Depending on your testing requirements, you may have to adjust and tweak the configuration to be used.
Open the recording in JMC, and you’ll see there’s a substantial amount of GC activity happening:
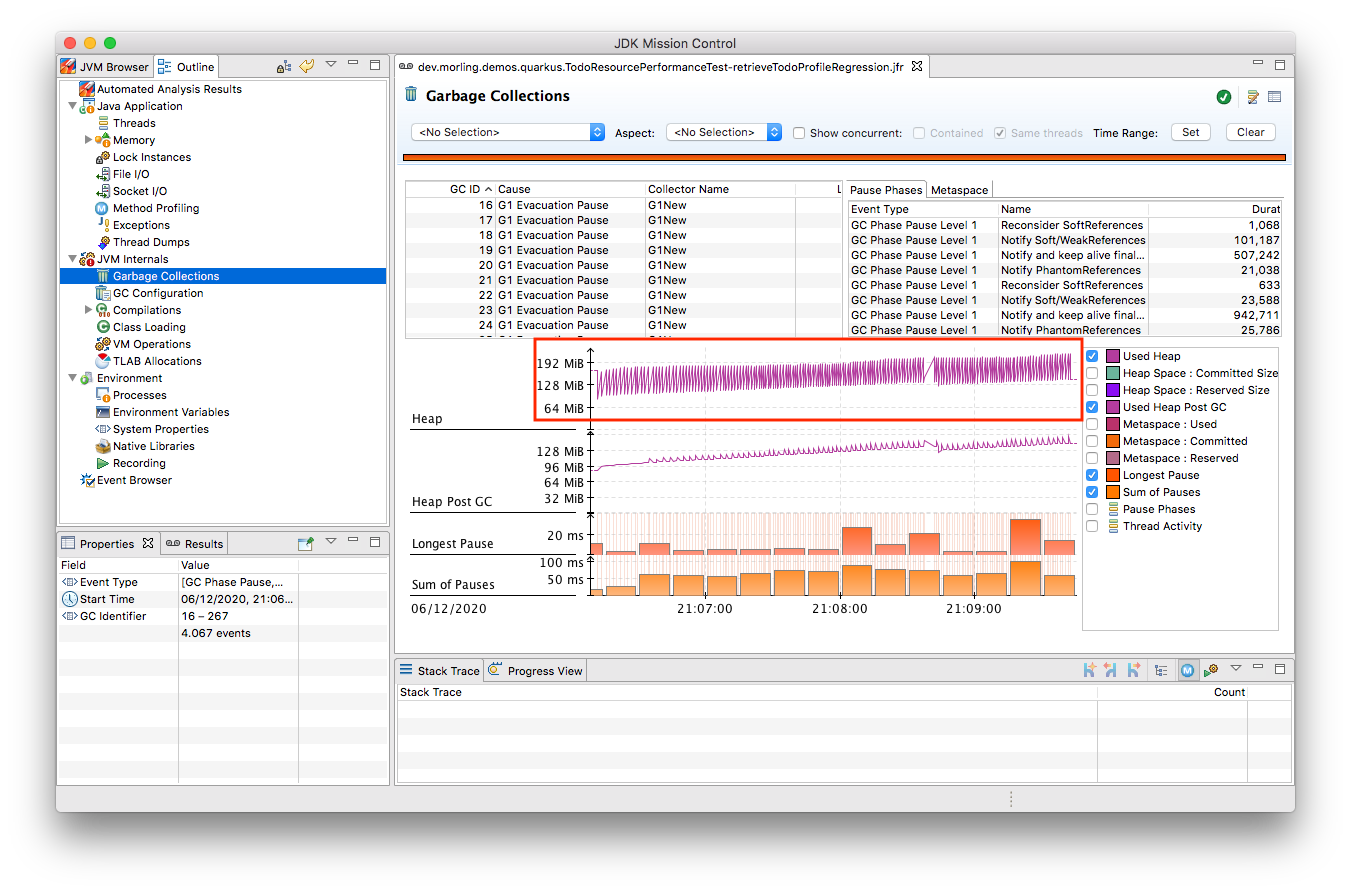
The difference to the GC behavior before this code change is striking:
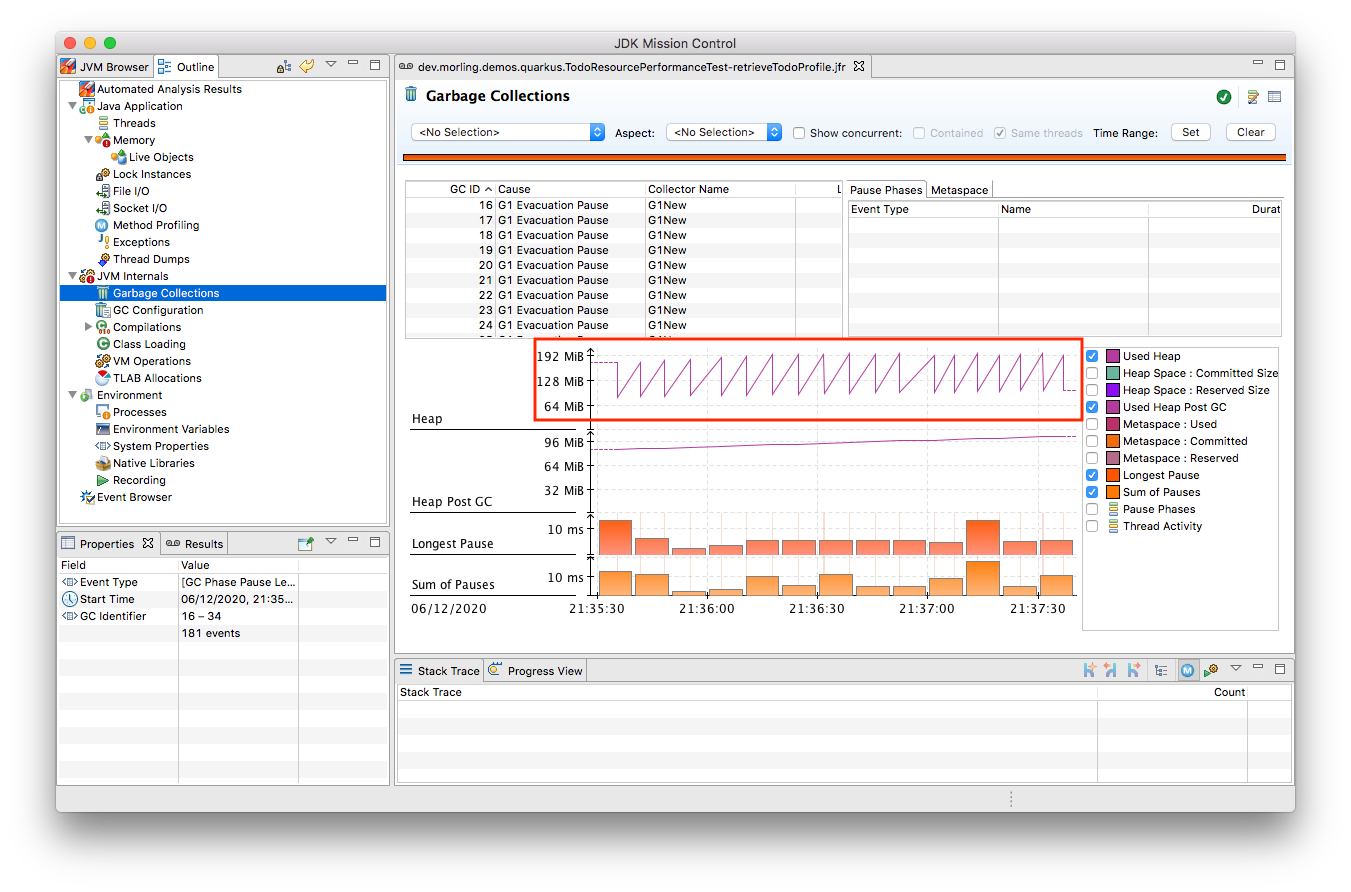
Pause times are worse, directly impacting the application’s latency, and the largely increased GC volume means the production environment will be able to serve less concurrent requests when reaching its capacity limits, meaning you’d have to provision another machine earlier on as your load increases.
|
Memory Leak in the JFR Event Streaming API
The astute reader may have noticed that there is a memory leak before and after the code change, as indicated by the ever increased heap size post GC.
After some exploration it turned out that this is a bug in the JFR event streaming API which holds on to a large number of |
Now such drastic increase of object allocation and thus potential impact on performance should hopefully be an exception rather than a regular situation. But the example shows how continuous performance unit tests on impacting metrics like memory allocation, using JfrUnit and JDK Flight Recorder and, can help to identify performance issues in an automated and reliable way, preventing such regression to sneak into production. Being able to identify this kind of issue by running tests locally on a developer laptop or a CI server can be a huge time-saver and productivity boost.
Case Study 2: Identifying Increased I/O With the Database
Once you’ve started to look at performance regression tests through the lense of JfrUnit,
more and more possibilities pop up.
Asserting a maximum number of garbage collections? Not a problem.
Avoiding an unexpected amount of file system IO? The jdk.FileRead and jdk.FileWrite events are our friend.
Examining and asserting the I/O done with the database? Easily doable.
Assertions on application-specific JFR event types you’ve defined yourself? Sure thing!
You can find a complete list of all JFR event types by JDK version in this nice matrix created by Tom Schindl. The number of JFR event types is growing constantly; as of JDK 15, there are 157 different ones of them.
Now let’s take a look at assertions on database I/O, as the amount of data fetched from or written to the database often is a very impactful factor of an enterprise application’s behavior. A regression here, e.g. fetching more data from the database than anticipated, may indicate that data is unnecessarily loaded. For instance it might be the case that a set of data is loaded only in order to filter it in the application subsequently, instead of doing so via SQL in the database itself, resulting in increased request durations.
So how could such test look like for our GET /todo/{id} API call?
The general approach is the same as before with memory allocations:
first define a baseline of the bytes read and written by invoking the API under test for a given number of executions.
Once that’s done, you can implement the actual test, including an assertion on the expected number of bytes read or written:
 1
 2
 3
 4
 5
 6
 7
 8
 9
10
11
12
13
14
15
16
17
18
19
20
21
22
23
24
25
26
27
28
29
30
31
32
33
34
35
36
@Test
@EnableEvent(value="jdk.SocketRead", stackTrace=INCLUDED) (1)
@EnableEvent(value="jdk.SocketWrite", stackTrace=INCLUDED)
public void retrieveTodo() throws Exception {
  Random r = new Random();
  HttpClient client = HttpClient.newBuilder()
      .build();

  for (int i = 1; i<= ITERATIONS; i++) {
    executeRequest(r, client);
  }

  jfrEvents.awaitEvents();

  long count = jfrEvents.filter(this::isDatabaseIoEvent).count(); (2)
  assertThat(count / ITERATIONS).isEqualTo(4)
      .describedAs("write + read per statement, write + read per commit");

  long bytesReadOrWritten = jfrEvents.filter(this::isDatabaseIoEvent)
      .mapToLong(this::getBytesReadOrWritten)
      .sum();

  assertThat(bytesReadOrWritten / ITERATIONS).isLessThan(250); (3)
}

private boolean isDatabaseIoEvent(RecordedEvent re) { (4)
  return ((re.getEventType().getName().equals("jdk.SocketRead") ||
      re.getEventType().getName().equals("jdk.SocketWrite")) &&
      re.getInt("port") == databasePort);
}

private long getBytesReadOrWritten(RecordedEvent re) { (5)
  return re.getEventType().getName().equals("jdk.SocketRead") ?
      re.getLong("bytesRead") :
      re.getLong("bytesWritten");
}
| 1 | Enable the jdk.SocketRead and jdk.SocketWrite event types; by default, those don’t contain the stacktrace for the events, so that needs to be enabled explicitly |
| 2 | There should be four events per invocation of the API method |
| 3 | Less than 250 bytes I/O are expected per invocation |
| 4 | Only read and write events on the database port are relevant for this test, but e.g. not I/O on the web port of the application |
| 5 | Retrieve the value of the event’s bytesRead or bytesWritten field, depending on the event type |
Now let’s again assume that after some time the test begins to fail. This time it’s the assertion on the number of executed reads and writes:
1
2
3
4
5
6
AssertionFailedError:
Expecting:
 <18L>
to be equal to:
 <4L>
but was not.
Also the number of bytes read and written has substantially increased:
1
2
3
4
5
java.lang.AssertionError:
Expecting:
 <1117L>
to be less than:
 <250L>
That’s definitely something to look into.
So let’s open the recording of the failed test in Flight Recorder and take a look at the socket read and write events.
Thanks to enabling stacktraces for the two JFR event types we can quite quickly identify the events asssociated to an invocation of the GET /todo/{id} API:
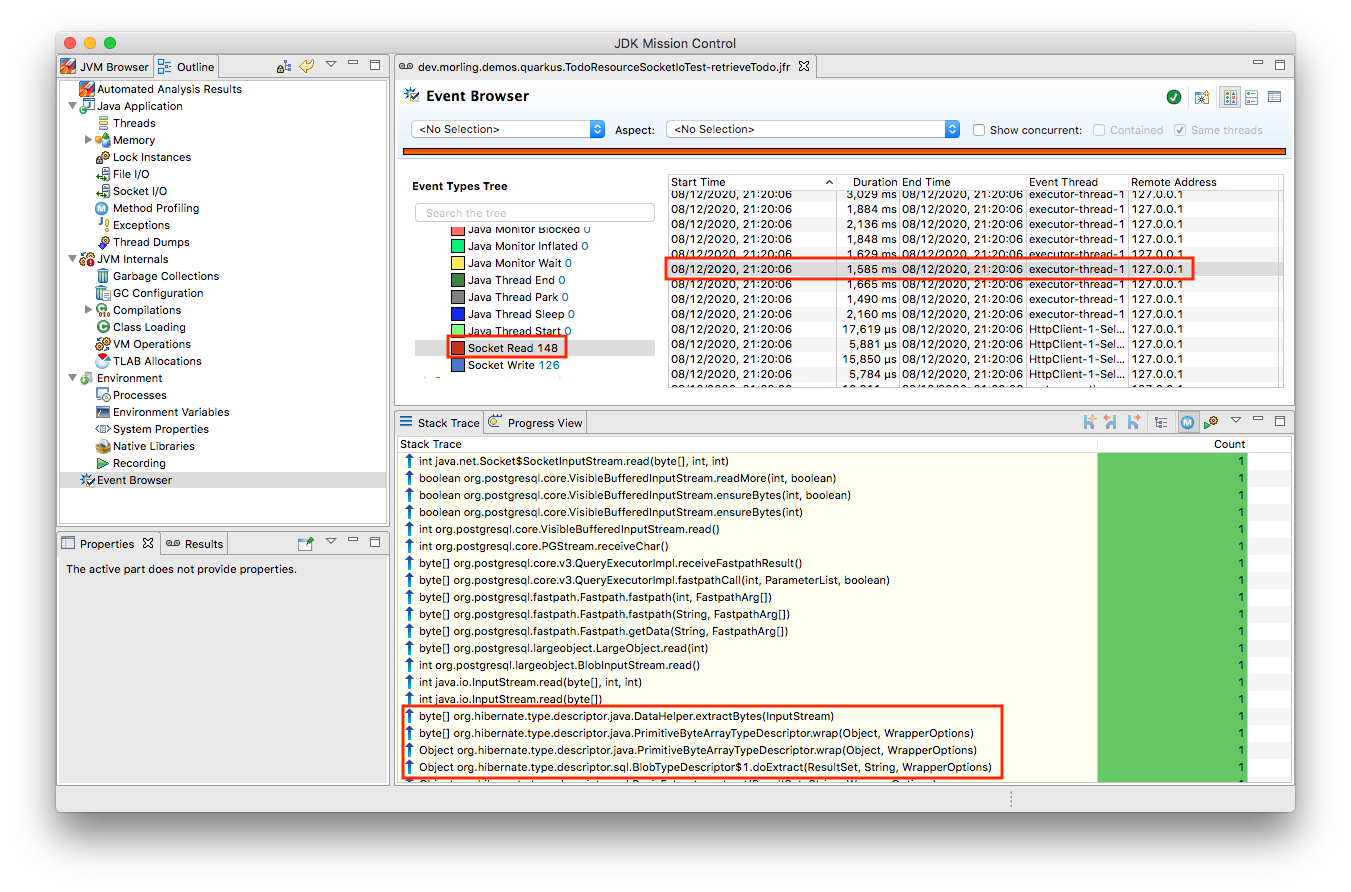
At this point, some familiarity with the application in question will come in handy to identify suspicous events.
But even without that, we could compare previous recordings of successful test runs with the recording from the failing one in order to see where differences are.
In the case at hand, the BlobInputStream and Hibernate’s BlobTypeDescriptor in the call stack seem pretty unexpected,
as our User entity didn’t have any BLOB attribute before.
In reality, comparing with the latest version and a look into the git history of that class could confirm that there’s a new attribute storing an image (perhaps not a best practice to do so ;):
 1
 2
 3
 4
 5
 6
 7
 8
 9
10
@Entity
public class Todo extends PanacheEntity {

  public String title;
  public int priority;
  public boolean completed;

  @Lob (1)
  public byte[] image;
}
| 1 | This looks suspicious! |
We now would have to decide whether this image attribute actually should be loaded for this particular use case, (if so, we’d have to adjust the test accordingly), or whether it would for instance make more sense to mark this property as a lazily loaded one and only retrieve it when actually required.
Solely working with the raw socket read and write events can be a bit cumbersome, though. Wouldn’t it be nice if we also had the actual SQL statement which caused this I/O? Glad you asked! Neither Hibernate nor the Postgres JDBC driver emit any JFR events at the moment (although well-informed sources are telling me that the Hibernate team wants to look into this). Therefore, in part two of this blog post series, we’ll discuss how to instrument an existing library to emit events like this, using a Java agent, without modifying the library in question.
Discussion
JfrUnit in conjunction with JDK Flight Recorder opens up a very interesting approach for identifying potential performance regressions in Java applications. Instead of directly measuring an application’s performance metrics, most notably latency and throughput, the idea is to measure and assert metrics that impact the performance characteristics. This allows you to implement stable and reliable automated performance regression tests, whose outcome does not depend on the capabilities of the execution environment (e.g. number/size of CPUs), or other influential factors like concurrently running programs.
Regressions in such impacting metrics, e.g. the amount of allocated memory, or bytes read from a database, are indicators that the application’s performance may have degraded. This approach offers some interesting advantages over performance tests on actual latency and throughput themselves:
-
Hardware independent: You can identify potential regressions also when running tests on hardware which is different (e.g. less powerful) from the actual production hardware
-
Fast feedback cycle: Being able to run performance regression tests on developer laptops, even in the IDE, allows for fast identification of potential regressions right during development, instead of having to wait for the results of less frequently executed test runs in a traditional performance test lab environment
-
Robustness: Tests are robust and not prone to factors such as the load induced by parallel jobs of a CI server or a virtualized/containerized environment
-
Pro-active identification of performance issues: Asserting a metric like memory allocation can help to identify future performance problems before they actual materialize; while the additional allocation rate may make no difference with the system’s load as of today, it may negatively impact latency and throughput as the system reaches its limits with increased load; being able to identify the increased allocation rate early on allows for a more efficient handling of the situation while working on the code, compared to when finding out about such regression only later on
-
Reduced need for warm-up: For traditional performance tests of Java-based applications, a thorough warm-up is mandatory, e.g. to ensure proper optimization of the JIT-compiled code. In comparison, metrics like file or database I/O are very stable for a defined workload, so that regressions can be identified also with just a single or a few executions
Needless to say, that you should be aware of the limitations of this approach, too:
-
No statement on user-visible performance metrics: Measuring and asserting performance-impacting factors doesn’t tell you anything in terms of the user-visible performance characteristics themselves. While we can reason about guarantees like "The system can handle 10K concurrent requests while the 99.9 percentile of requests has a latency of less than 250 ms", that’s not the case for metrics like memory allocation or I/O. What does it mean if an application allocates 100 KB of RAM for a particular use case? Is it a lot? Too much? Just fine?
-
Focused on identifying regressions: Somewhat related to the first point, this approach of testing is focused not on specific absolute values, but rather on identifying performance regressions. It’s hard to tell whether 100 KB database I/O is good or bad for a particular web request, but a change from 100 KB to 200 KB might indicate that something is wrong
-
Focused on identifying potential regressions: A change in performance-impacting metrics does not necessarily imply an actual user-visible performance regression. For instance it might be acceptable for a specific request to allocate more RAM than it did before, if the production system generally isn’t under high load and the additional GC effort doesn’t matter in practice
-
Does not work for all performance-impacting metrics: Some performance metrics cannot be meaningfully asserted in plain unit tests; e.g. degraded throughput due to lock contention can typically only be identified with a reasonable number of concurrent requests
-
Only identifies regressions in the application itself: A traditional integrative performance test of an enterprise application will also capture issues in related components, such as the application’s database. A query run with a sub-optimal execution plan won’t be noticed with this testing approach
-
Volatile results for timer-based tasks: While metrics like object allocations should be stable e.g. for a specific web request, events which are timing-based, would yield more events on a slower environment than on a faster machine
Summary and Outlook
JUnit tests based on performance-impacting factors can be a very useful part of the performance testing strategy for an application. They can help to identify potential performance regressions very early in the development lifecycle, when they can be fixed comparatively easy and cheap. Of course they are no silver bullet; you should consider them as complement for classic performance tests running on production-like hardware, not a replacement.
The approach may feel a bit unfamiliar initially, and it may take some time to learn about the different metrics which can be measured with JFR and asserted via JfrUnit, as well as their implications on an application’s performance characteristics. But once this hurdle is passed, continuous performance regression tests can be a valuable tool in the box of every software and performance engineer.
JfrUnit is still in its infancy, and could evolve into a complete toolkit around automated test of JFR-based metrics. Ideas for future development include:
-
A more powerful "built-in" API which e.g. provides the functionality for calculating the total TLAB allocations of a given set of threads as a ready-to-use method
-
It could also be very interesting to run assertions against externally collected JFR recording files. This would allow to validate workloads which require more complex set-ups, e.g. running in a dedicated performance testing lab, or even from continuous recordings taken in production
-
The JFR event streaming API could be leveraged for streaming queries on live events streamed from a remote system
-
Another use case we haven’t explored yet is the validation of resource consumption before and after a defined workload. E.g. after logging in and out a user 100 times, the system should roughly consume — ignoring any initial growth after starting up — the same amount of memory. A failure of such assertion would indicate a potential memory leak in the application
-
JfrUnit might automatically detect that certain metrics like object allocations are still undergoing some kind of warm-up phase and thus are not stable, and mark such tests as potentially incorrect or flaky
-
Keeping track of historical measurement data, e.g. allowing to identify regressions which got introduced step by step over a longer period of time, with one comparatively small change being the straw finally breaking the camel’s back
Your feedback, feature requests, or even contributions to the project will be highly welcomed!
Stay tuned for part two of this blog post, where we’ll explore how to trace the SQL statements executed by an application using the JMC Agent and assert these query events using JfrUnit. This will come in very handy for instance for identifying common performance problems like N+1 SELECT statements.
Many thanks to Hans-Peter Grahsl, John O’Hara, Nitsan Wakart, and Sanne Grinovero for their extensive feedback while writing this blog post!