
While working on a demo for processing change events from Postgres with Apache Flink, I noticed an interesting phenomenon: A Postgres database which I had set up for that demo on Amazon RDS, ran out of disk space. The machine had a disk size of 200 GiB which was fully used up in the course of less than two weeks.
Now a common cause for this kind of issue are replication slots which are not advanced: in that case, Postgres will hold on to all WAL segments after the latest log sequence number (LSN) which was confirmed for that slot. Indeed I had set up a replication slot (via the Decodable CDC source connector for Postgres, which is based on Debezium). I then had stopped that connector, causing the slot to become inactive. The problem was though that I was really sure that there was no traffic in that database whatsoever! What could cause a WAL growth of ~18 GB/day then?
What follows is a quick write-up of my investigations, mostly as a reference for my future self, but I hope this will come in handy for others in the same situation, too.
The Observation
Let’s start with the observations I made. I don’t have the data and log files from the original situation any longer, but the following steps are enough to reproduce the issue. The first thing is to create a new Postgres database on Amazon RDS (I used version 14.5 on the free tier). Then get a session on the database and create a replication slot like this:
1
2
3
4
5
6
SELECT * FROM pg_create_logical_replication_slot(
  'regression_slot',
  'test_decoding',
  false,
  true
);
Now grab a coffee (or two, or three), and after some hours take a look into the metrics of the database in the RDS web console. "Free Storage Space" shows the following, rather unpleasant, picture:
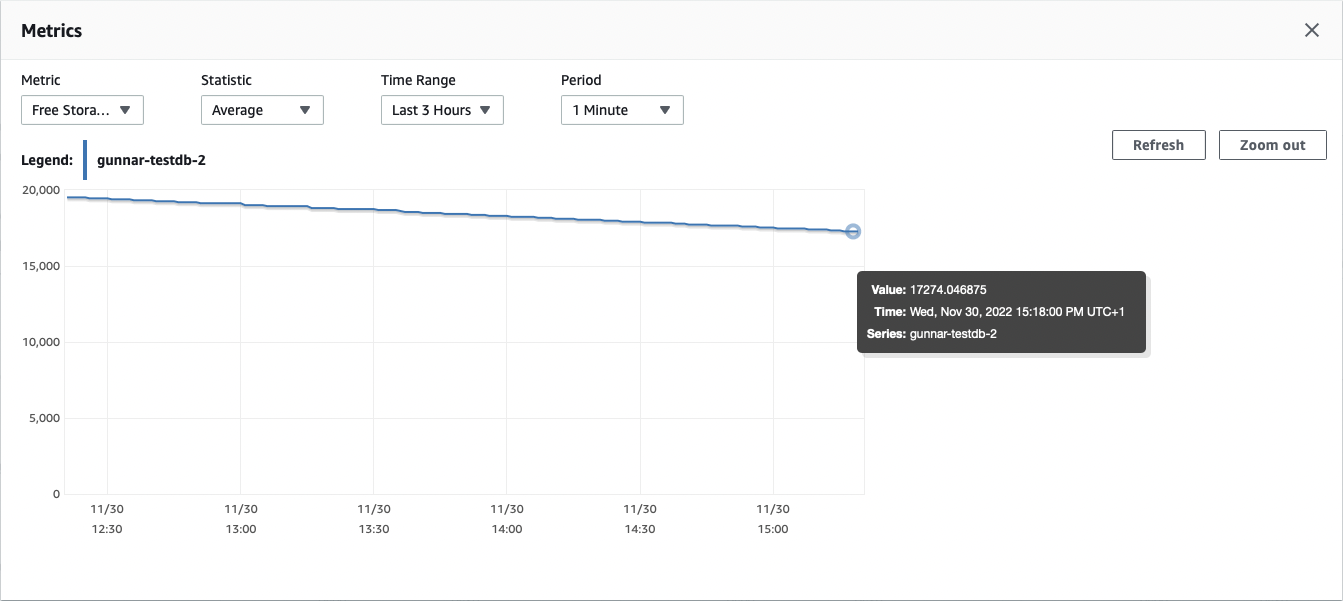
We’ve lost more than two GB within three hours, meaning that the 20 GiB free tier database would run out of disk space within less than two days. Next, let’s take a look at the "Transaction Log Disk Usage" metric. It shows the problem in a very pronounced way:
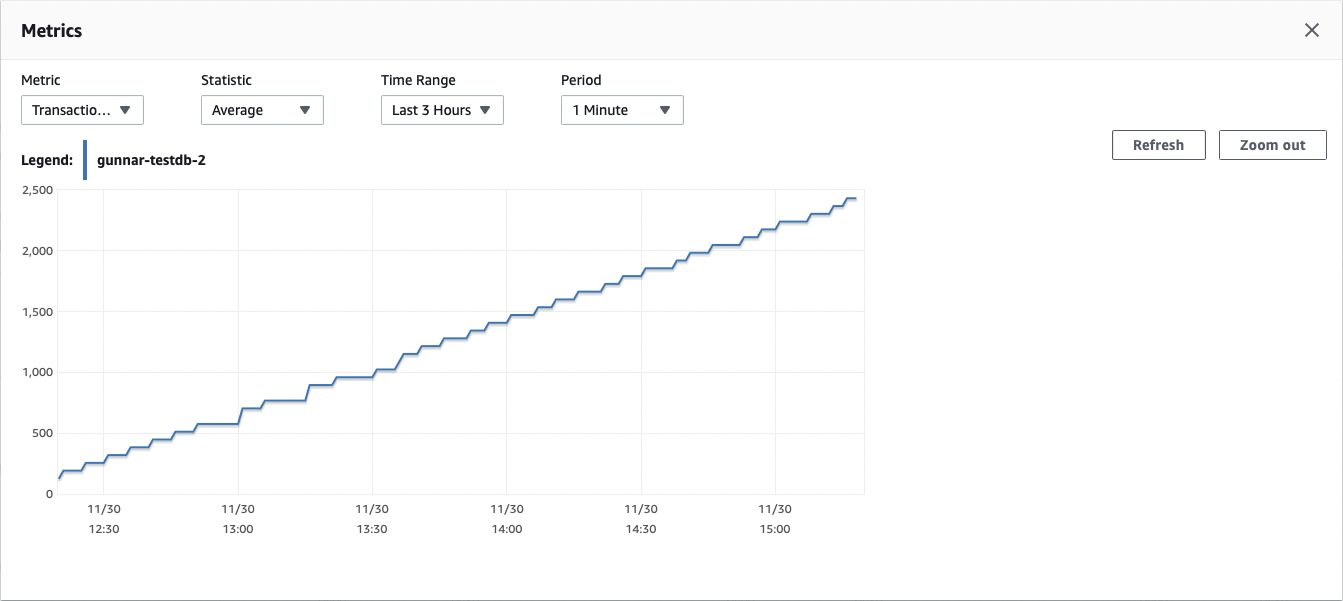
Roughly very few minutes the transaction log of the database grows by 64 MB. The "Write IOPS" metric further completes this picture. Again, every five minutes something causes write IOPS in that idle database:
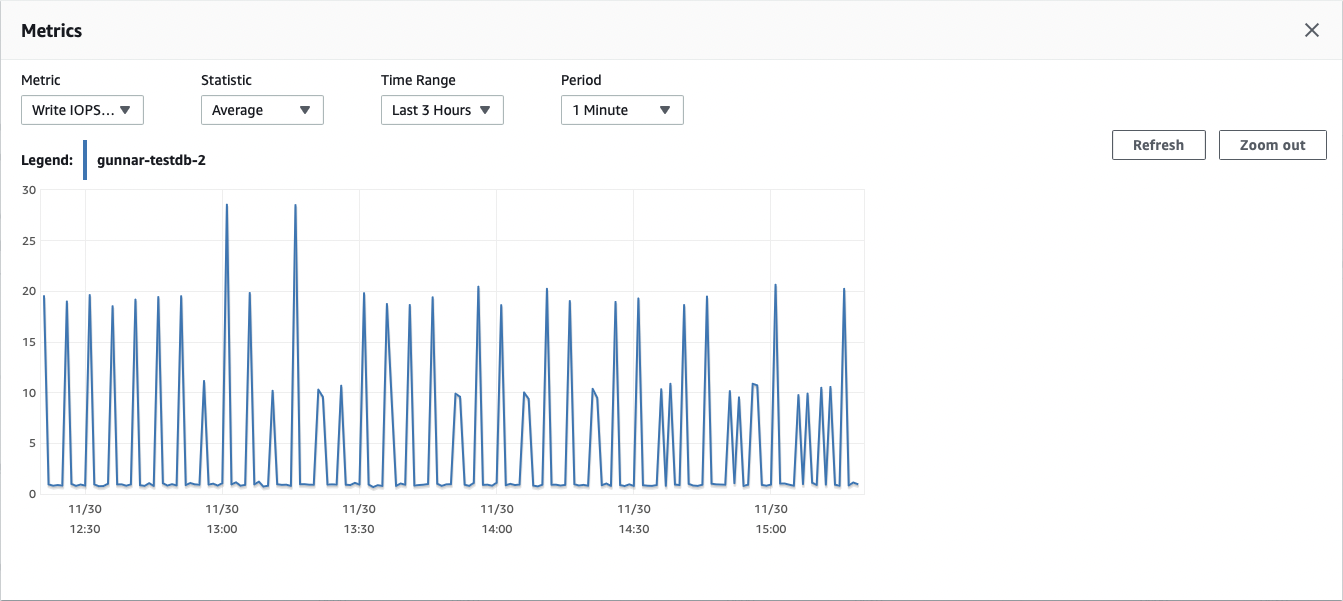
Now let’s see whether our replication slot actually is the culprit. By looking at the difference between its restart LSN (the earliest LSN which the database needs to retain in order to allow for this slot to resume) and the database’s current LSN we see how much bytes of WAL this slot prevents from being freed while it is inactive:
 1
 2
 3
 4
 5
 6
 7
 8
 9
10
11
12
SELECT
  slot_name,
  pg_size_pretty(
    pg_wal_lsn_diff(
      pg_current_wal_lsn(), restart_lsn)) AS retained_wal,
  active,
  restart_lsn FROM pg_replication_slots;
+-----------------+----------------+----------+---------------+
| slot_name       | retained_wal   | active   | restart_lsn   |
|-----------------+----------------+----------+---------------|
| regression_slot | 2166 MB        | False    | 0/4A05AF0     |
+-----------------+----------------+----------+---------------+
Pretty much exactly the size of the WAL we saw in the database metrics. The big question now is of course what is causing that growth of the WAL? Which process is adding 64 MB to it every five minutes? So let’s take a look at the active server processes in Postgres, using the pg_stat_activity view:
 1
 2
 3
 4
 5
 6
 7
 8
 9
10
11
12
13
14
15
16
17
SELECT pid AS process_id,
  usename AS username,
  datname AS database_name,
  client_addr AS client_address,
  application_name,
  backend_start,
  state,
  state_change
FROM pg_stat_activity
WHERE usename IS NOT NULL;
+--------------+------------+-----------------+------------------+------------------------+-------------------------------+---------+-------------------------------+
| process_id   | username   | database_name   | client_address   | application_name       | backend_start                 | state   | state_change                  |
|--------------+------------+-----------------+------------------+------------------------+-------------------------------+---------+-------------------------------|
| 370          | rdsadmin   | <null>          | <null>           |                        | 2022-11-30 11:11:03.424359+00 | <null>  | <null>                        |
| 468          | rdsadmin   | rdsadmin        | 127.0.0.1        | PostgreSQL JDBC Driver | 2022-11-30 11:12:02.517528+00 | idle    | 2022-11-30 14:15:05.601626+00 |
| 14760        | postgres   | decodabletest   | www.xxx.yyy.zzz  | pgcli                  | 2022-11-30 14:04:58.765899+00 | active  | 2022-11-30 14:15:06.820204+00 |
+--------------+------------+-----------------+------------------+------------------------+-------------------------------+---------+-------------------------------+
This is interesting: besides our own session (user postgres),
there’s also two other sessions by a user rdsadmin.
As we don’t do any data changes ourselves, they must be somehow related to the WAL growth we observe.
The Solution
At this point I had enough information to do some meaningful Google search,
and I came across the blog post "Postgres Logical Replication and Idle Databases" by Byron Wolfman,
who ran into the exact same issue as I did.
As it turns out, RDS is periodically writing heartbeats into that rdsadmin database:
In RDS, we write to a heartbeat table in our internal "rdsadmin" database every 5 minutes
This is one part of the explanation: in our seemingless inactive RDS Postgres database, there actually is some traffic. But how is it possible that this heartbeat causes such a large amount of WAL growth? Surely those heartbeat events won’t be 64 MB large?
Another blog post hinted at the next bit of information: as of Postgres 11, the WAL segment size — i.e. the size of individual files making up the WAL — can be configured. On RDS, this is changed from the default of 16 MB to 64 MB. This sounds familiar!
That knowledge center post also led me to the last missing piece of the puzzle, the archive_timeout parameter, which defaults to five minutes.
This is what the excellent postgresqlco.nf site has to say about this option:
When this parameter is greater than zero, the server will switch to a new segment file whenever this amount of time has elapsed since the last segment file switch, and there has been any database activity … Note that archived files that are closed early due to a forced switch are still the same length as completely full files.
And this finally explains why that inactive replication slot causes the retention of that much WAL on an idle database:
there actually are some data changes made every five minutes in form of that heartbeat in the rdsadmin database.
This in turn causes a new WAL segment of 64 MB to be created every five minutes.
As long as that replication slot is inactive and doesn’t make any progress,
all those WAL segments will be kept,
(not so) slowly causing the database server to run out of disk space.
Take Away
The morale of the story? Don’t leave your replication slots unattended! There shouldn’t be any slots which are inactive for too long. For instance you could set up an alert based on the query above which notifies you if some slot retains WAL of more than 100 MB. And of course you should monitor your free disk space, too.
That being said, you still might be in for a bad surprise: under specific instances, also an active replication slot can cause unexpected WAL retention. If for instance large amounts of changes are being made to one database but a replication slot has been set up for another database which doesn’t receive any changes, that slot still won’t be able to make any progress.
A common solution to that scenario is inducing some sort of artificial traffic into the database,
as for instance supported by the Debezium Postgres connector.
Note this doesn’t even require a specific tables,
periodically writing a message just to the WAL using pg_logical_emit_message() is enough:
1
SELECT pg_logical_emit_message(false, 'heartbeat', now()::varchar);
If you use a logical decoding plug-in which supports logical replication messages — like pgoutput since Postgres 14 — then that’s all that’s needed for letting your replication slot advance within an otherwise idle database.