
The other day at work, we had a situation where we suspected a thread leak in one particular service, i.e. code which continuously starts new threads, without taking care of ever stopping them again. Each thread requires a bit of memory for its stack space, so starting an unbounded number of threads can be considered as a form of memory leak, causing your application to run out of memory eventually. In addition, the more threads there are, the more overhead the operating system incurs for scheduling them, until the scheduler itself will consume most of the available CPU resources. Thus it’s vital to detect and fix this kind of problem early on.
The usual starting point for analyzing a suspected thread leak is taking a thread dump, for instance using the jstack CLI tool or via JDK Mission Control; if there’s an unexpected large number of threads (oftentimes with similar or even identical names), then it’s very likely that something is wrong indeed. But a thread dump by itself is only a snapshot of the thread state at a given time, i.e. it doesn’t tell you how the thread count is changing over time (perhaps there are many threads which are started but also stopped again?), and it also doesn’t provide you with information about the cause, i.e. which part of your application is starting all those threads. Does it happen in your own code base, or within some 3rd party dependency? While the thread names and stacks in the dump can give you some idea, that information isn’t necessarily enough for a conclusive root cause analysis.
Luckily, Java’s built-in event recorder and performance analysis tool, JDK Flight Recorder, exposes all the data you need to identify thread leaks and their cause. So let’s take a look at the details, bidding farewell to those pesky thread leaks once and forever!
The first JFR event type to look at is jdk.JavaThreadStatistics:
recorded every second by default, it keeps track of active, accumulated, and peak thread counts.
Here is a JFR recording from a simple thread leak demo application I’ve created
(newest events at the top):
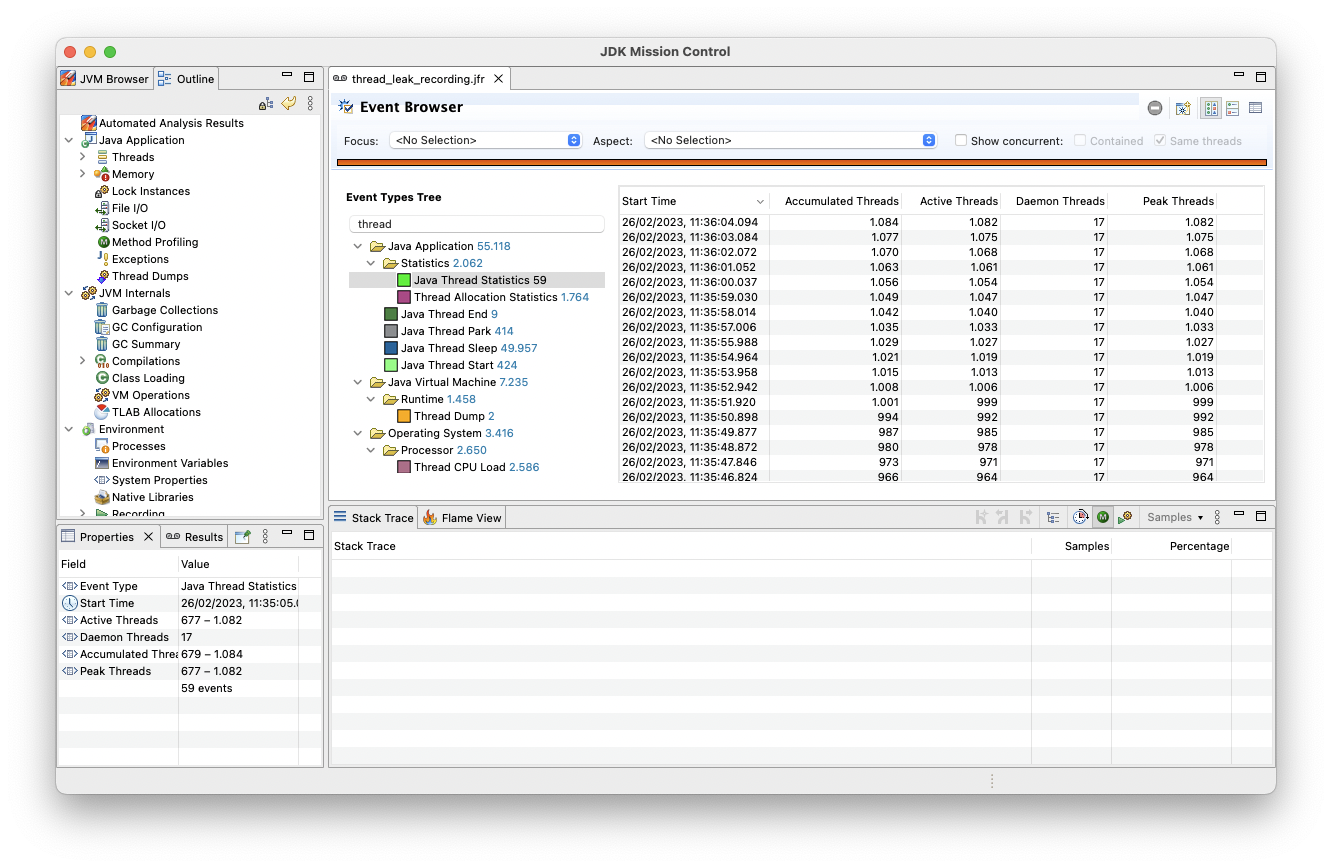
The number of active threads is continuously increasing, never going back down again — pretty clearly that this a thread leak. Now let’s figure out where exactly all those threads are coming from.
For this, two other JFR event types come in handy: jdk.ThreadStart and jdk.ThreadEnd.
The former captures all the relevant information when a thread is started:
time stamp, name of the new thread and the parent thread, and the stack trace of the parent thread when starting the child thread.
The latter event type will be recorded when a thread finishes.
If we find many thread start events originating at the same code location without a corresponding end event
(correlated via the thread id contained in the events), this is very likely a source of a thread leak.
This sort of event analysis is a perfect use case for JFR Analytics.
This tool allows you to analyze JFR recordings using standard SQL (leveraging Apache Calcite under the hood).
In JFR Analytics, each event type is represented by its own "table".
Finding thread start events without matching end events is as simple as running a LEFT JOIN on the two event types and keeping only those start events which don’t have a join partner.
So let’s load the file into the SQLLine command line client (see the README of JFR Analytics for instructions on building and launching this tool):
1
2
3
!connect jdbc:calcite:schemaFactory=org.moditect.jfranalytics.JfrSchemaFactory;schema.file=thread_leak_recording.jfr dummy dummy

!outputformat vertical
Run the following SQL query for finding thread start events without corresponding thread join events:
1
2
3
4
5
6
7
8
SELECT
  ts."startTime",
  ts."parentThread"."javaName" as "parentThread",
  ts."eventThread"."javaName" AS "newThread",
  TRUNCATE_STACKTRACE(ts."stackTrace", 20) AS "stackTrace"
FROM "jdk.ThreadStart" ts LEFT JOIN "jdk.ThreadEnd" te
  ON ts."eventThread"."javaThreadId" = te."eventThread"."javaThreadId"
WHERE te."startTime" IS NULL;
Note how the parentThread and eventThread columns are of a complex SQL type, allowing you to refer to thread properties such as javaName or javaThreadId using dot notation.
In that simple example recording, there’s one stack trace which dominates the result set, so looking at any of the events reveals the culprit:
 1
 2
 3
 4
 5
 6
 7
 8
 9
10
11
12
13
14
15
16
17
18
19
20
21
22
23
startTime   2023-02-26 11:36:04.284
javaName    executor-thread-0
javaName    pool-1060-thread-1
stackTrace  java.lang.System$2.start(Thread, ThreadContainer):2528
jdk.internal.vm.SharedThreadContainer.start(Thread):160
java.util.concurrent.ThreadPoolExecutor.addWorker(Runnable, boolean):953
java.util.concurrent.ThreadPoolExecutor.execute(Runnable):1364
java.util.concurrent.AbstractExecutorService.submit(Callable):145
java.util.concurrent.Executors$DelegatedExecutorService.submit(Callable):791
org.acme.GreetingResource.hello():18
null
null
null
null
jdk.internal.reflect.DirectMethodHandleAccessor.invoke(Object, Object[]):104
java.lang.reflect.Method.invoke(Object, Object[]):578
org.jboss.resteasy.core.MethodInjectorImpl.invoke(HttpRequest, HttpResponse, Object, Object[]):170
org.jboss.resteasy.core.MethodInjectorImpl.invoke(HttpRequest, HttpResponse, Object):130
org.jboss.resteasy.core.ResourceMethodInvoker.internalInvokeOnTarget(HttpRequest, HttpResponse, Object):660
org.jboss.resteasy.core.ResourceMethodInvoker.invokeOnTargetAfterFilter(HttpRequest, HttpResponse, Object):524
org.jboss.resteasy.core.ResourceMethodInvoker.lambda$invokeOnTarget$2(HttpRequest, HttpResponse, Object):474
null
org.jboss.resteasy.core.interception.jaxrs.PreMatchContainerRequestContext.filter():364
The call for creating a new thread apparently is initiated by the GreetingResource::hello() method by submitting a Callable to an executor service.
And surely enough, this is how it looks like:
 1
 2
 3
 4
 5
 6
 7
 8
 9
10
11
@GET
@Produces(MediaType.TEXT_PLAIN)
public String hello() {
    ExecutorService executor = Executors.newSingleThreadExecutor();
    executor.submit(() -> {
        while (true) {
            Thread.sleep(1000L);
        }
    });
    return "Hello World";
}
If things are not as clear-cut as in that contrived example, it can be useful to truncate stack traces to a reasonable line count
(e.g. it should be save to assume that the user code starting a thread is never further away than ten frames from the actual thread start call) and group by that.
JFR Analytics provides the built-in function TRUNCATE_STACKTRACE for this purpose:
1
2
3
4
5
6
7
8
9
SELECT
  TRUNCATE_STACKTRACE(ts."stackTrace", 10) AS "stackTrace",
  COUNT(1) AS "threadCount"
FROM "jdk.ThreadStart" ts LEFT JOIN "jdk.ThreadEnd" te
  ON ts."eventThread"."javaThreadId" = te."eventThread"."javaThreadId"
WHERE te."startTime" IS NULL
GROUP BY
  TRUNCATE_STACKTRACE(ts."stackTrace", 10)
ORDER BY "threadCount" DESC;
This points at the problematic stack traces and code locations in a very pronounced way (output slightly adjusted for better readability):
 1
 2
 3
 4
 5
 6
 7
 8
 9
10
11
12
13
14
15
16
17
18
19
stackTrace   java.lang.System$2.start(Thread, ThreadContainer):2528
jdk.internal.vm.SharedThreadContainer.start(Thread):160
java.util.concurrent.ThreadPoolExecutor.addWorker(Runnable, boolean):953
java.util.concurrent.ThreadPoolExecutor.execute(Runnable):1364
java.util.concurrent.AbstractExecutorService.submit(Callable):145
java.util.concurrent.Executors$DelegatedExecutorService.submit(Callable):791
org.acme.GreetingResource.hello():18
null
null
null

threadCount  414
---
stackTrace   java.util.Timer.<init>(String, boolean):188
jdk.jfr.internal.PlatformRecorder.lambda$createTimer$0(List):101
null
java.lang.Thread.run():1589

threadCount  1
Sometimes you may encounter a situation where new threads are started from within other threads in a 3rd party dependency, rather than directly from threads within your own code base. In that case the stack traces of the thread start events may not tell you enough about the root cause of the problem, i.e. where those other "intermediary" threads are coming from, and how they relate to your own code.
To dig into the details here, you can leverage the fact that each jdk.ThreadStart event contains information about the parent thread which started a new thread.
So you can join the jdk.ThreadStart table to itself on the parent thread’s id,
fetching also the stack traces of the code starting those parent threads:
 1
 2
 3
 4
 5
 6
 7
 8
 9
10
11
12
SELECT
  ts."startTime",
  pts."parentThread"."javaName" AS "grandParentThread",
  ts."parentThread"."javaName" AS "parentThread",
  ts."eventThread"."javaName" AS "newThread",
  TRUNCATE_STACKTRACE(pts."stackTrace", 15) AS "parentStackTrace",
  TRUNCATE_STACKTRACE(ts."stackTrace", 15) AS "stackTrace"
FROM "jdk.ThreadStart" ts LEFT JOIN "jdk.ThreadEnd" te
  ON ts."startTime" = te."startTime"
  JOIN "jdk.ThreadStart" pts
  ON ts."parentThread"."javaThreadId" = pts."eventThread"."javaThreadId"
WHERE te."startTime" IS NULL;
Here, stackTrace is the trace of a thread (named "pool-728-thread-1") of an external library, "greeting provider", which starts another (leaking) thread (named "pool-729-thread-1"),
and parentStackTrace points to the code in our own application (thread name "executor-thread-0") which started that first thread:
 1
 2
 3
 4
 5
 6
 7
 8
 9
10
11
12
13
14
15
16
17
18
19
20
21
22
23
24
25
26
27
28
29
30
31
32
33
34
35
startTime          2023-02-28 09:15:24.493
grandParentThread  executor-thread-0
parentThread       pool-728-thread-1
newThread          pool-729-thread-1
parentStackTrace   java.lang.System$2.start(Thread, ThreadContainer):2528
jdk.internal.vm.SharedThreadContainer.start(Thread):160
java.util.concurrent.ThreadPoolExecutor.addWorker(Runnable, boolean):953
java.util.concurrent.ThreadPoolExecutor.execute(Runnable):1364
java.util.concurrent.AbstractExecutorService.submit(Runnable):123
java.util.concurrent.Executors$DelegatedExecutorService.submit(Runnable):786
com.example.greeting.GreetingService.greet():20
com.example.greeting.GreetingService_ClientProxy.greet()
org.acme.GreetingResource.hello():20
null
null
null
null
jdk.internal.reflect.DirectMethodHandleAccessor.invoke(Object, Object[]):104
java.lang.reflect.Method.invoke(Object, Object[]):578
---
stackTrace         java.lang.System$2.start(Thread, ThreadContainer):2528
jdk.internal.vm.SharedThreadContainer.start(Thread):160
java.util.concurrent.ThreadPoolExecutor.addWorker(Runnable, boolean):953
java.util.concurrent.ThreadPoolExecutor.execute(Runnable):1364
java.util.concurrent.AbstractExecutorService.submit(Callable):145
java.util.concurrent.Executors$DelegatedExecutorService.submit(Callable):791
com.example.greeting.GreetingProvider.createGreeting():13
com.example.greeting.GreetingProvider_ClientProxy.createGreeting()
com.example.greeting.GreetingService.lambda$greet$0(AtomicReference):21
null
java.util.concurrent.Executors$RunnableAdapter.call():577
java.util.concurrent.FutureTask.run():317
java.util.concurrent.ThreadPoolExecutor.runWorker(ThreadPoolExecutor$Worker):1144
java.util.concurrent.ThreadPoolExecutor$Worker.run():642
java.lang.Thread.run():1589
If the thread hierarchy is even deeper, you could continue down that path and keep joining more and more parent threads until you’ve arrived at the application’s main thread.
I was hoping to leverage recursive query support in Calcite for this purpose,
but as it turned out, support for this only exists in the Calcite RelBuilder API at the moment,
while the RECURSIVE keyword is not supported for SQL queries yet.
Equipped with JDK Flight Recorder, JDK Mission Control, and JFR Analytics,
identifying and fixing thread leaks in your Java application is becoming a relatively simple task.
The jdk.JavaThreadStatistics, jdk.ThreadStart, and jdk.ThreadEnd event types are enabled in the default JFR profile,
which is meant for permanent usage in production.
I.e. you can keep a size-capped continuous recording running all the time,
dump it into a file whenever needed, and then start the analysis process as described above.
Taking things a step further, you could also set up monitoring and alerting on the number of active threads,
e.g. by exposing the jdk.JavaThreadStatistics event via a remote JFR event recording stream,
allowing you to react in real-time whenever the active thread count reaches an unexpected high level.